colour.plotting.diagrams.plot_spectral_locus
-
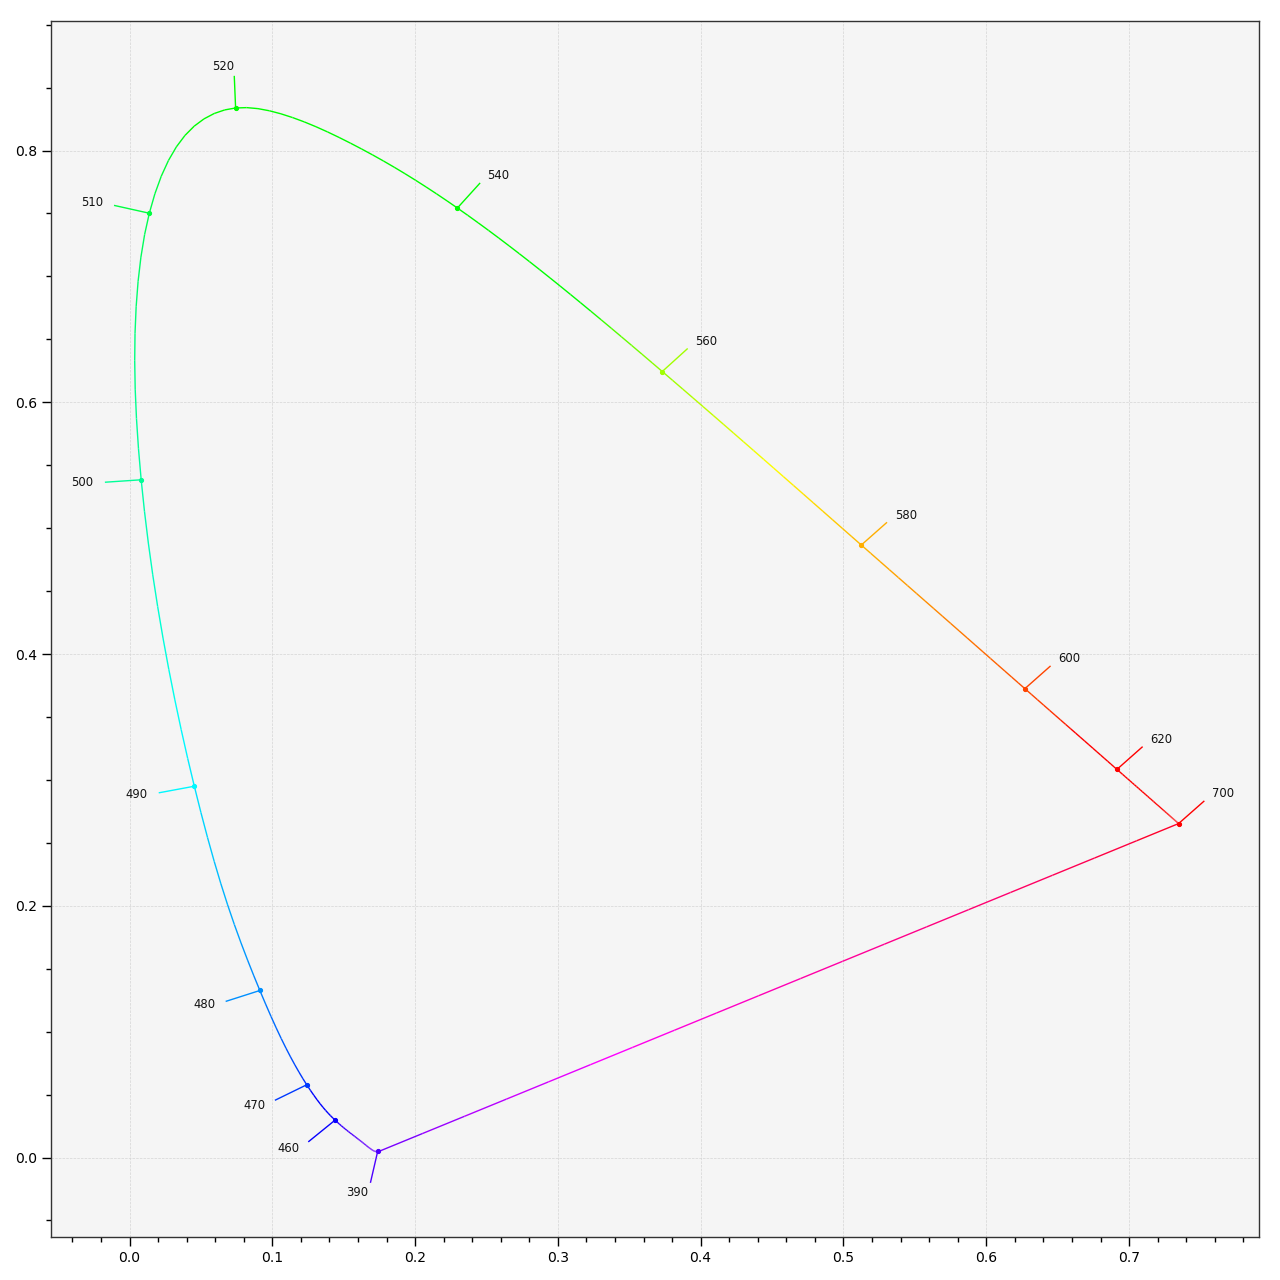
colour.plotting.diagrams.plot_spectral_locus(cmfs='CIE 1931 2 Degree Standard Observer', spectral_locus_colours=None, spectral_locus_labels=None, method='CIE 1931', **kwargs)[source]¶ Plots the Spectral Locus according to given method.
Parameters: - cmfs (unicode, optional) – Standard observer colour matching functions defining the Spectral Locus.
- spectral_locus_colours (array_like or unicode, optional) – Spectral Locus colours, if
spectral_locus_coloursis set to RGB, the colours will be computed according to the corresponding chromaticity coordinates. - spectral_locus_labels (array_like, optional) – Array of wavelength labels used to customise which labels will be drawn around the spectral locus. Passing an empty array will result in no wavelength labels being drawn.
- method (unicode, optional) – {‘CIE 1931’, ‘CIE 1960 UCS’, ‘CIE 1976 UCS’}, Chromaticity Diagram method.
Other Parameters: **kwargs (dict, optional) – {
colour.plotting.artist(),colour.plotting.render()}, Please refer to the documentation of the previously listed definitions.Returns: Current figure and axes.
Return type: Examples
>>> plot_spectral_locus(spectral_locus_colours='RGB') # doctest: +SKIP