colour.plotting.plot_RGB_chromaticities_in_chromaticity_diagram_CIE1960UCS
-
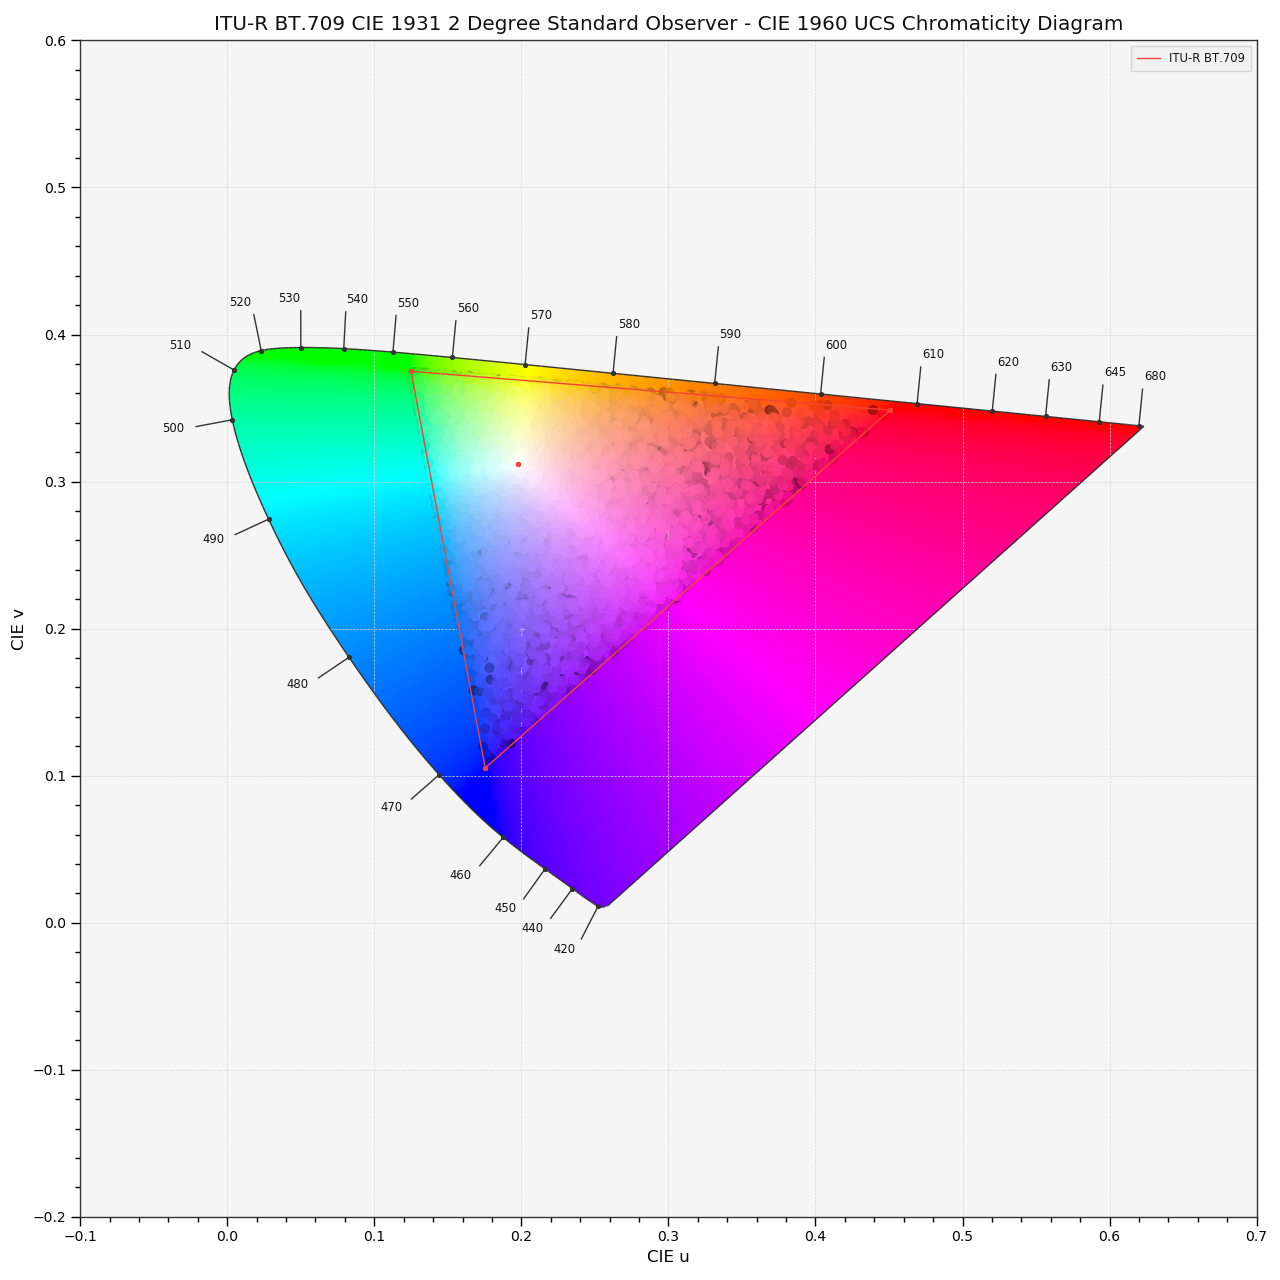
colour.plotting.plot_RGB_chromaticities_in_chromaticity_diagram_CIE1960UCS(RGB, colourspace='sRGB', chromaticity_diagram_callable_CIE1960UCS=<function plot_RGB_colourspaces_in_chromaticity_diagram_CIE1960UCS>, scatter_parameters=None, **kwargs)[source]¶ Plots given RGB colourspace array in the CIE 1960 UCS Chromaticity Diagram.
Parameters: - RGB (array_like) – RGB colourspace array.
- colourspace (optional, unicode) – RGB colourspace of the RGB array.
- chromaticity_diagram_callable_CIE1960UCS (callable, optional) – Callable responsible for drawing the CIE 1960 UCS Chromaticity Diagram.
- scatter_parameters (dict, optional) – Parameters for the
plt.scatter()definition, ifcis set to RGB, the scatter will use givenRGBcolours.
Other Parameters: **kwargs (dict, optional) – {
colour.plotting.artist(),colour.plotting.diagrams.plot_chromaticity_diagram(),colour.plotting.diagrams.plot_RGB_colourspaces_in_chromaticity_diagram(),colour.plotting.render()}, Please refer to the documentation of the previously listed definitions.Returns: Current figure and axes.
Return type: Examples
>>> RGB = np.random.random((128, 128, 3))
>>> plot_RGB_chromaticities_in_chromaticity_diagram_CIE1960UCS(
...     RGB, 'ITU-R BT.709')
... # doctest: +SKIP