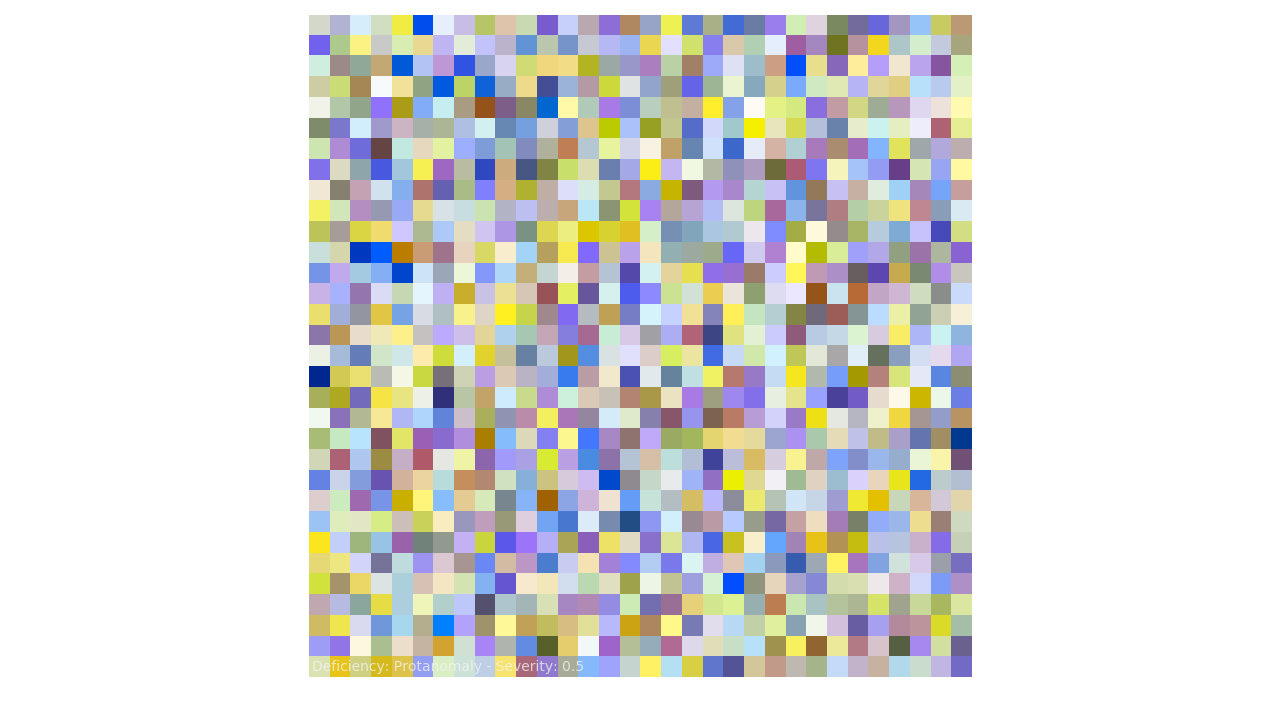
colour.plotting.plot_cvd_simulation_Machado2009
-
colour.plotting.plot_cvd_simulation_Machado2009(RGB, deficiency='Protanomaly', severity=0.5, M_a=None, **kwargs)[source]¶ Performs colour vision deficiency simulation on given RGB colourspace array using Machado et al. (2009) model.
Parameters: - RGB (array_like) – RGB colourspace array.
- deficiency (unicode, optional) – {‘Protanomaly’, ‘Deuteranomaly’, ‘Tritanomaly’} Colour blindness / vision deficiency type.
- severity (numeric, optional) – Severity of the colour vision deficiency in domain [0, 1].
- M_a (array_like, optional) – Anomalous trichromacy matrix to use instead of Machado (2010) pre-computed matrix.
Other Parameters: **kwargs (dict, optional) – {
colour.plotting.artist(),colour.plotting.plot_image(),colour.plotting.render()}, Please refer to the documentation of the previously listed definitions.Notes
- Input RGB array is expected to be linearly encoded.
Returns: Current figure and axes. Return type: tuple Examples
>>> import numpy as np
>>> RGB = np.random.rand(32, 32, 3)
>>> plot_cvd_simulation_Machado2009(RGB)  # doctest: +SKIP
