colour.plotting.plot_multi_functions
-
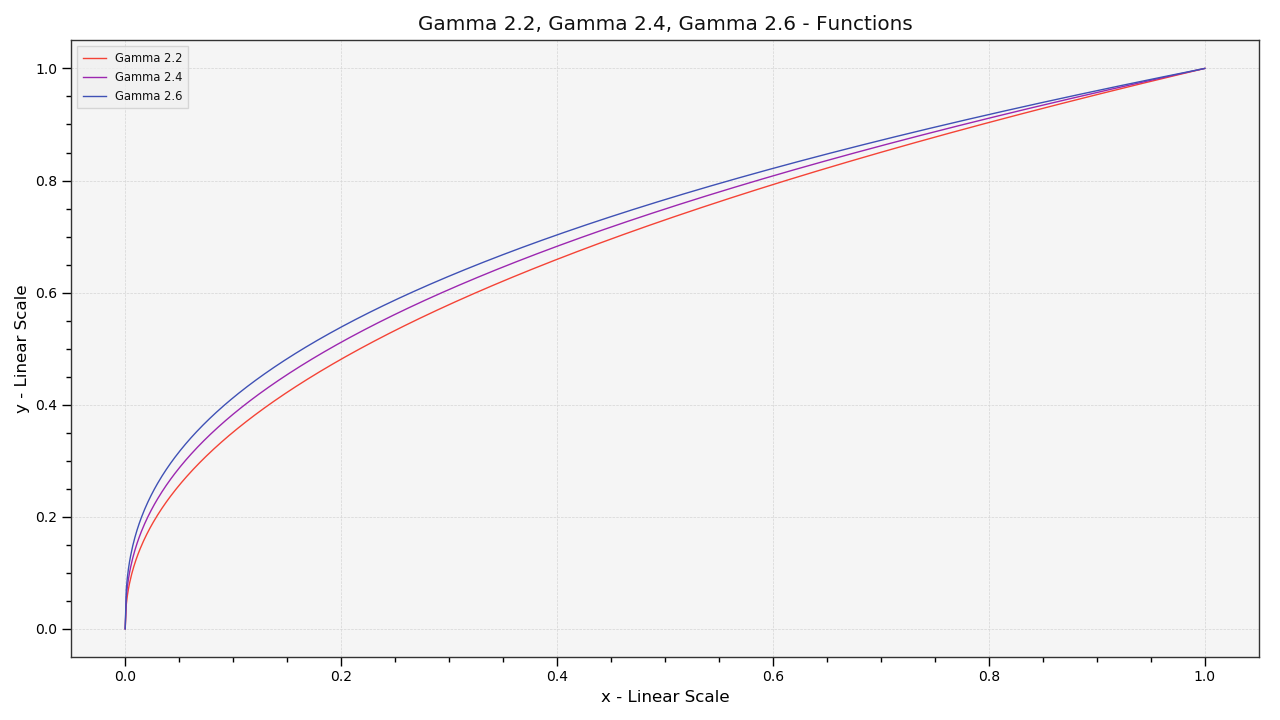
colour.plotting.plot_multi_functions(functions, samples=None, log_x=None, log_y=None, **kwargs)[source]¶ Plots given functions.
Parameters: - functions (dict) – Functions to plot.
- samples (array_like, optional,) – Samples to evaluate the functions with.
- log_x (int, optional) – Log base to use for the x axis scale, if None, the x axis scale will be linear.
- log_y (int, optional) – Log base to use for the y axis scale, if None, the y axis scale will be linear.
Other Parameters: **kwargs (dict, optional) – {
colour.plotting.artist(),colour.plotting.render()}, Please refer to the documentation of the previously listed definitions.Returns: Current figure and axes.
Return type: Examples
>>> functions = {
...     'Gamma 2.2' : lambda x: x ** (1 / 2.2),
...     'Gamma 2.4' : lambda x: x ** (1 / 2.4),
...     'Gamma 2.6' : lambda x: x ** (1 / 2.6),
... }
>>> plot_multi_functions(functions)
... # doctest: +SKIP