colour.plotting.plot_multi_sds_colour_rendering_indexes_bars
-
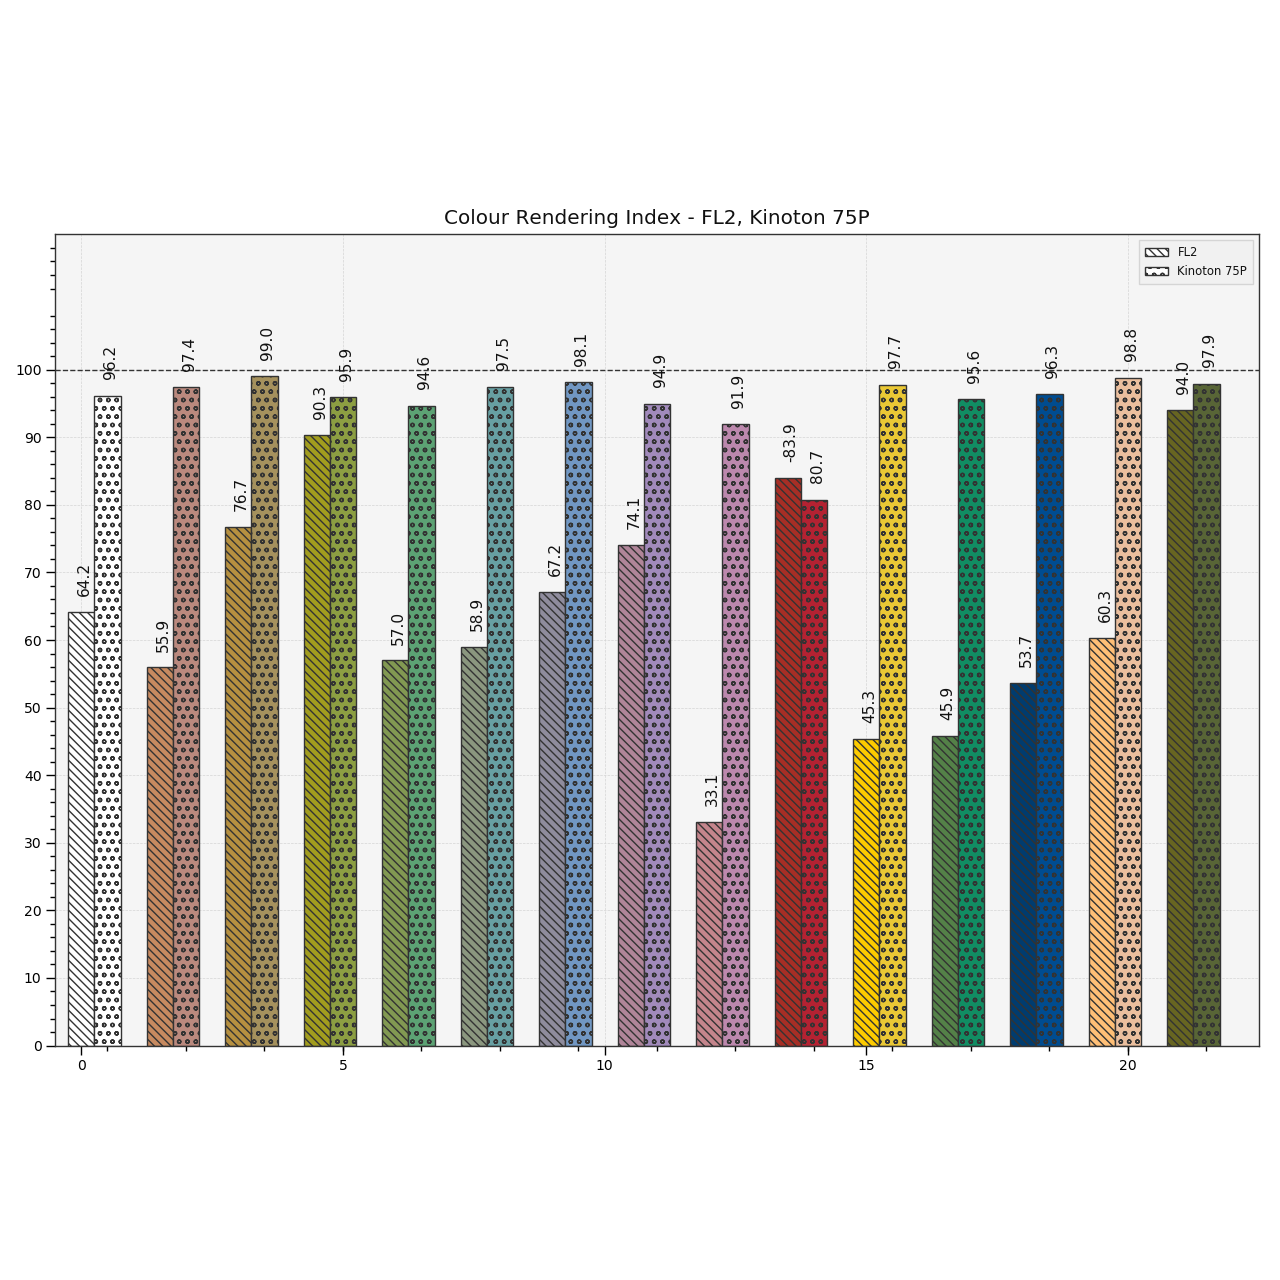
colour.plotting.plot_multi_sds_colour_rendering_indexes_bars(sds, **kwargs)[source]¶ Plots the Colour Rendering Index (CRI) of given illuminants or light sources spectral distributions.
Parameters: sds (array_like) – Array of illuminants or light sources spectral distributions to plot the Colour Rendering Index (CRI).
Other Parameters: - **kwargs (dict, optional) – {
colour.plotting.artist(),colour.plotting.quality.plot_colour_quality_bars(),colour.plotting.render()}, Please refer to the documentation of the previously listed definitions. - labels (bool, optional) – {
colour.plotting.quality.plot_colour_quality_bars()}, Add labels above bars. - hatching (bool or None, optional) – {
colour.plotting.quality.plot_colour_quality_bars()}, Use hatching for the bars. - hatching_repeat (int, optional) – {
colour.plotting.quality.plot_colour_quality_bars()}, Hatching pattern repeat.
Returns: Current figure and axes.
Return type: Examples
>>> from colour import (ILLUMINANTS_SDS,
...                     LIGHT_SOURCES_SDS)
>>> illuminant = ILLUMINANTS_SDS['FL2']
>>> light_source = LIGHT_SOURCES_SDS['Kinoton 75P']
>>> plot_multi_sds_colour_rendering_indexes_bars(
...     [illuminant, light_source])  # doctest: +SKIP
- **kwargs (dict, optional) – {