colour.plotting.plot_visible_spectrum
-
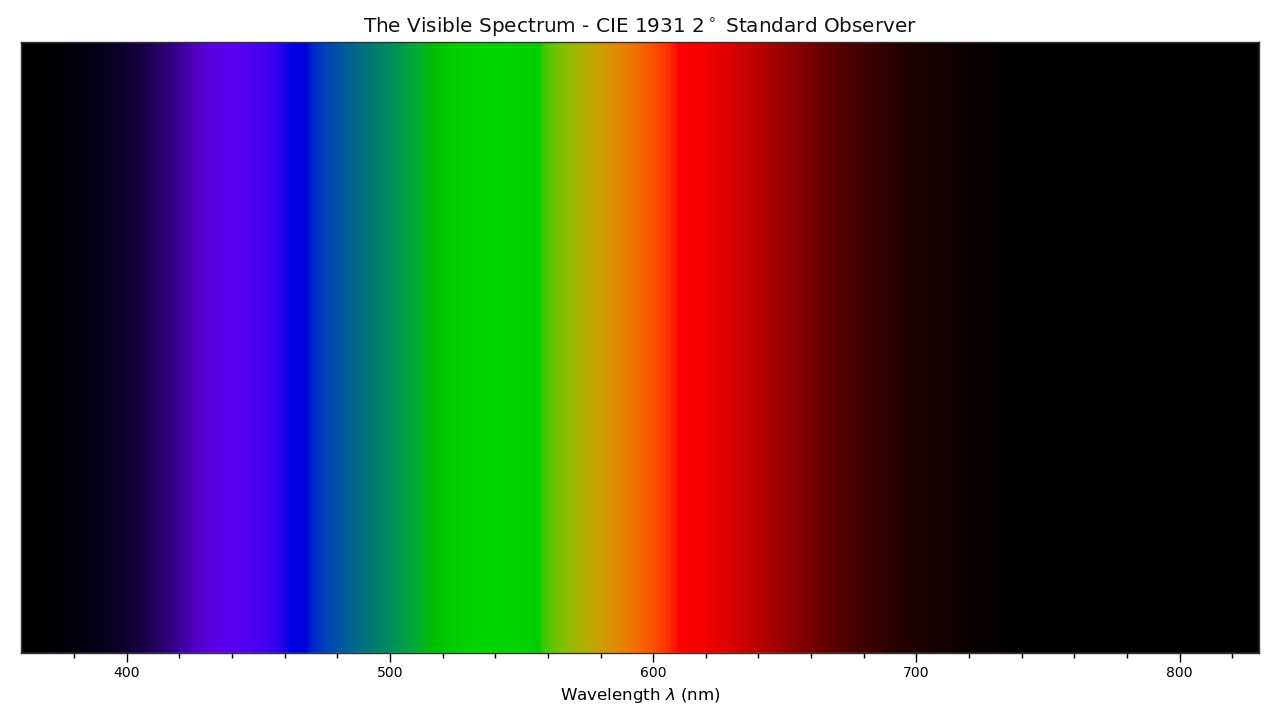
colour.plotting.plot_visible_spectrum(cmfs='CIE 1931 2 Degree Standard Observer', out_of_gamut_clipping=True, **kwargs)[source]¶ Plots the visible colours spectrum using given standard observer CIE XYZ colour matching functions.
Parameters: - cmfs (unicode, optional) – Standard observer colour matching functions used for spectrum creation.
- out_of_gamut_clipping (bool, optional) – Whether to clip out of gamut colours otherwise, the colours will be offset by the absolute minimal colour leading to a rendering on gray background, less saturated and smoother.
Other Parameters: **kwargs (dict, optional) – {
colour.plotting.artist(),colour.plotting.plot_single_sd(),colour.plotting.render()}, Please refer to the documentation of the previously listed definitions.Returns: Current figure and axes.
Return type: References
Examples
>>> plot_visible_spectrum() # doctest: +SKIP