colour.plotting.diagrams.plot_spectral_locus
-
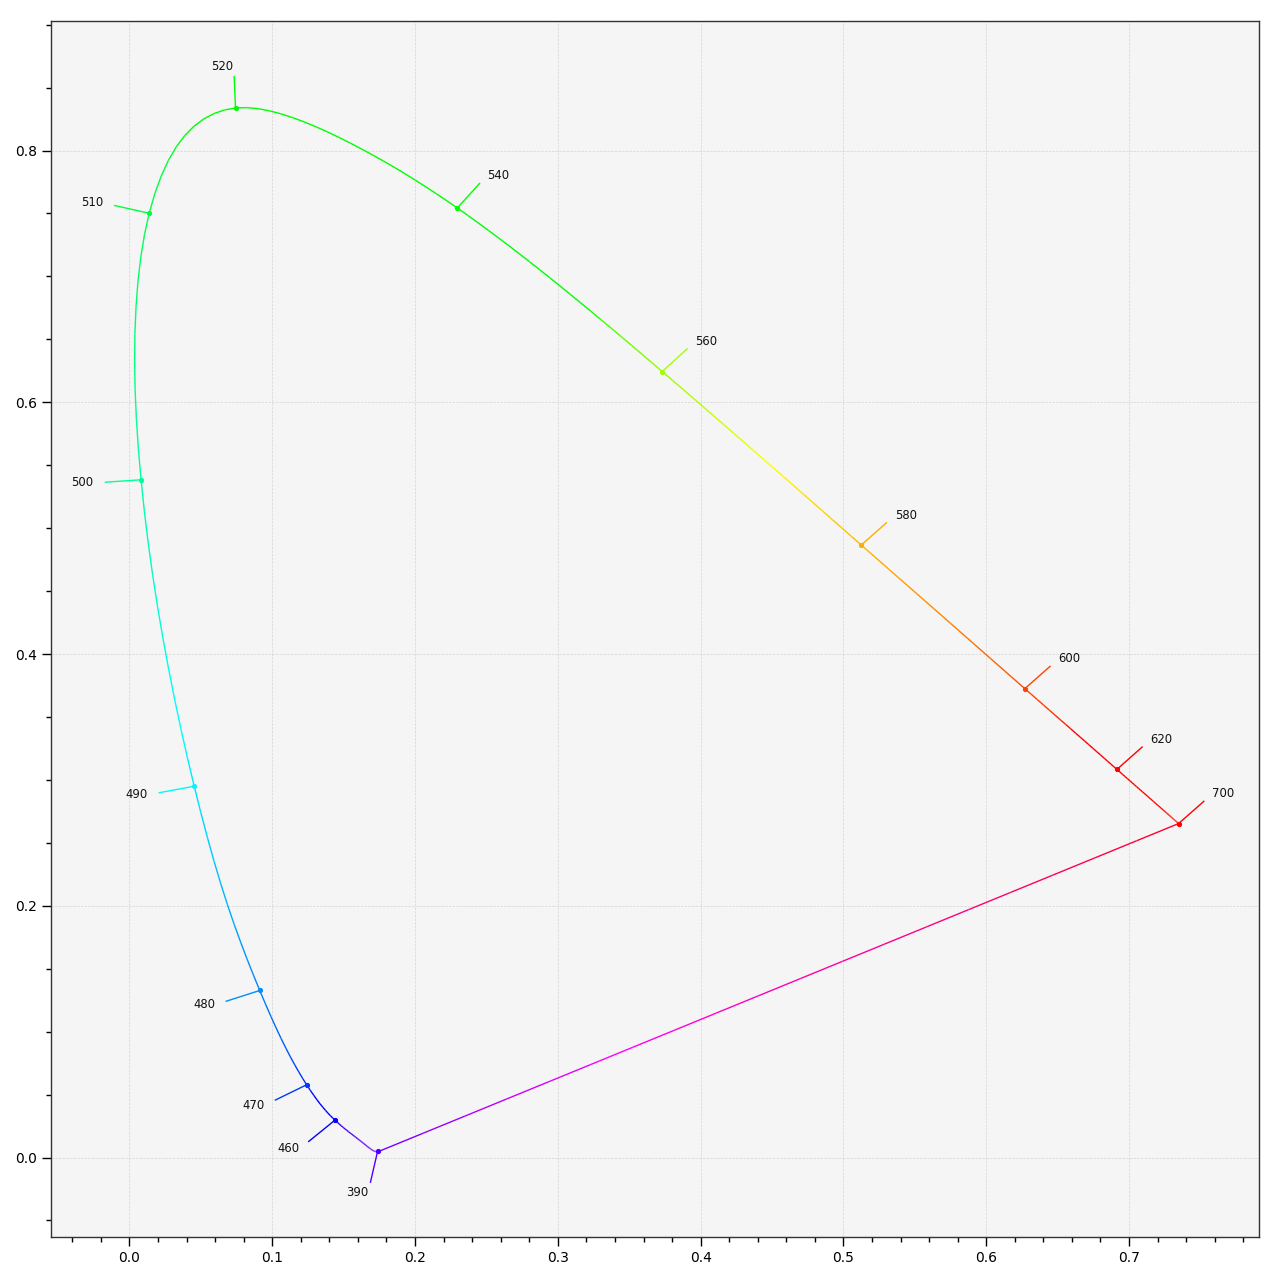
colour.plotting.diagrams.plot_spectral_locus(cmfs='CIE 1931 2 Degree Standard Observer', spectral_locus_colours=None, spectral_locus_labels=None, method='CIE 1931', **kwargs)[source]¶ Plots the Spectral Locus according to given method.
- Parameters
cmfs (unicode, optional) – Standard observer colour matching functions defining the Spectral Locus.
spectral_locus_colours (array_like or unicode, optional) – Spectral Locus colours, if
spectral_locus_coloursis set to RGB, the colours will be computed according to the corresponding chromaticity coordinates.spectral_locus_labels (array_like, optional) – Array of wavelength labels used to customise which labels will be drawn around the spectral locus. Passing an empty array will result in no wavelength labels being drawn.
method (unicode, optional) – {‘CIE 1931’, ‘CIE 1960 UCS’, ‘CIE 1976 UCS’}, Chromaticity Diagram method.
- Other Parameters
**kwargs (dict, optional) – {
colour.plotting.artist(),colour.plotting.render()}, Please refer to the documentation of the previously listed definitions.- Returns
Current figure and axes.
- Return type
Examples
>>> plot_spectral_locus(spectral_locus_colours='RGB')
(<Figure size ... with 1 Axes>, <matplotlib.axes._subplots.AxesSubplot object at 0x...>)