colour.plotting.models.plot_pointer_gamut
-
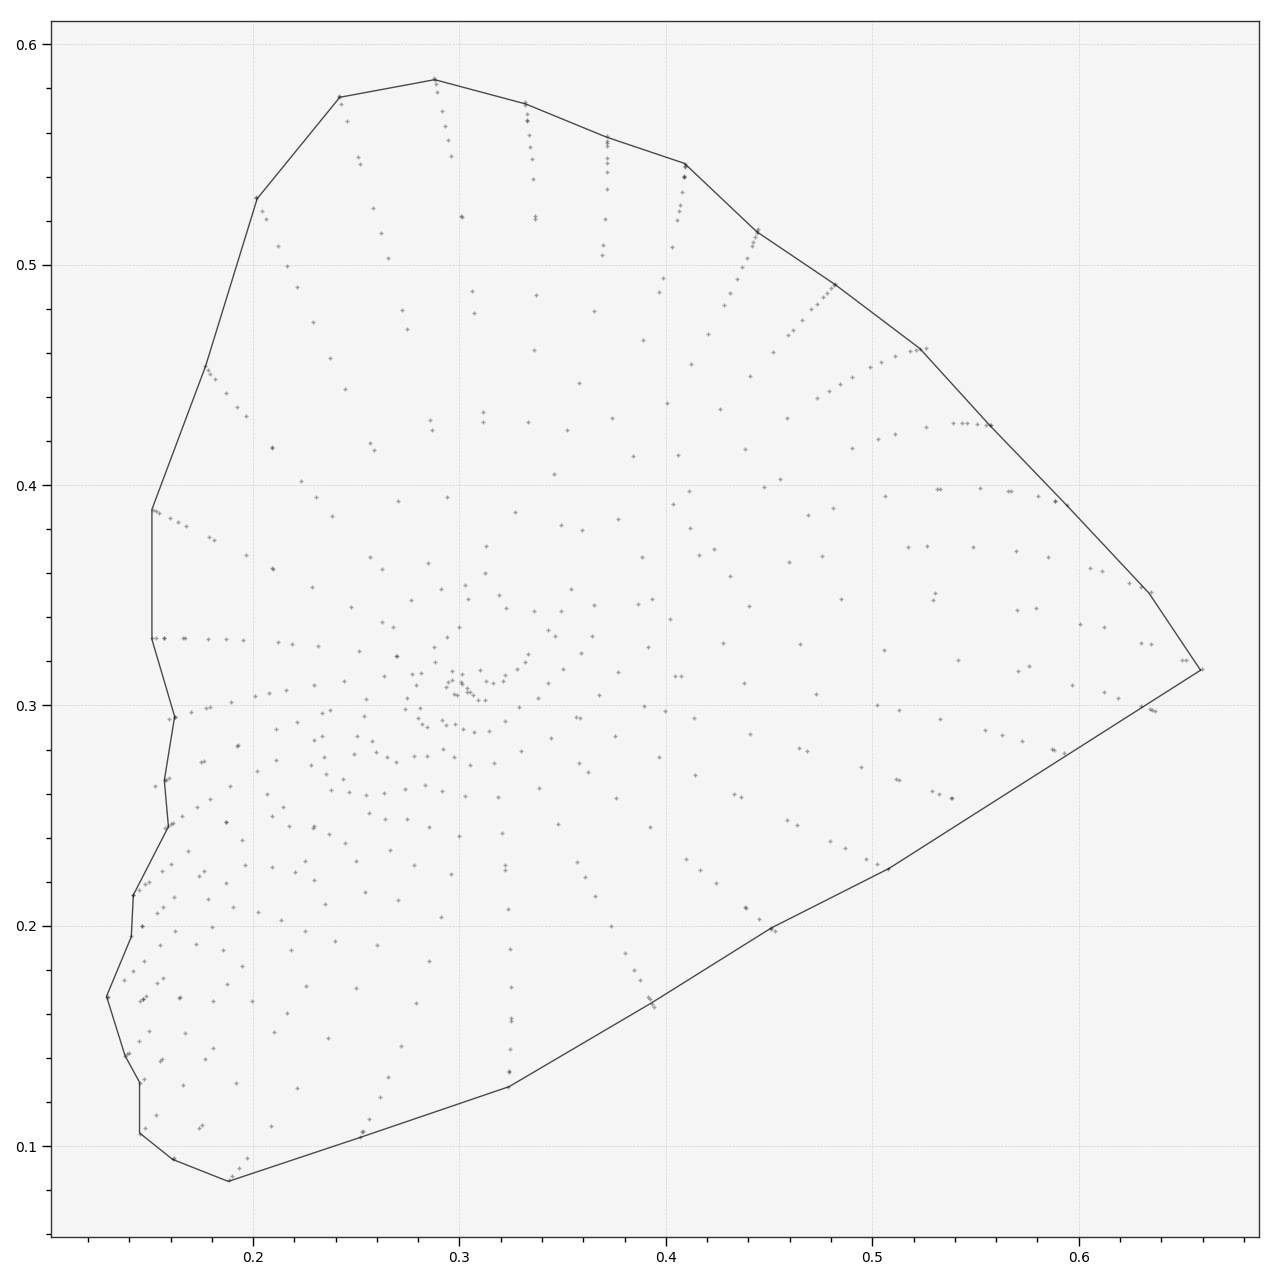
colour.plotting.models.plot_pointer_gamut(method='CIE 1931', **kwargs)[source]¶ Plots Pointer’s Gamut according to given method.
- Parameters
method (unicode, optional) – {‘CIE 1931’, ‘CIE 1960 UCS’, ‘CIE 1976 UCS’}, Plotting method.
- Other Parameters
**kwargs (dict, optional) – {
colour.plotting.artist(),colour.plotting.render()}, Please refer to the documentation of the previously listed definitions.- Returns
Current figure and axes.
- Return type
Examples
>>> plot_pointer_gamut()
(<Figure size ... with 1 Axes>, <matplotlib.axes._subplots.AxesSubplot object at 0x...>)