colour.plotting.plot_RGB_colourspaces_gamuts
-
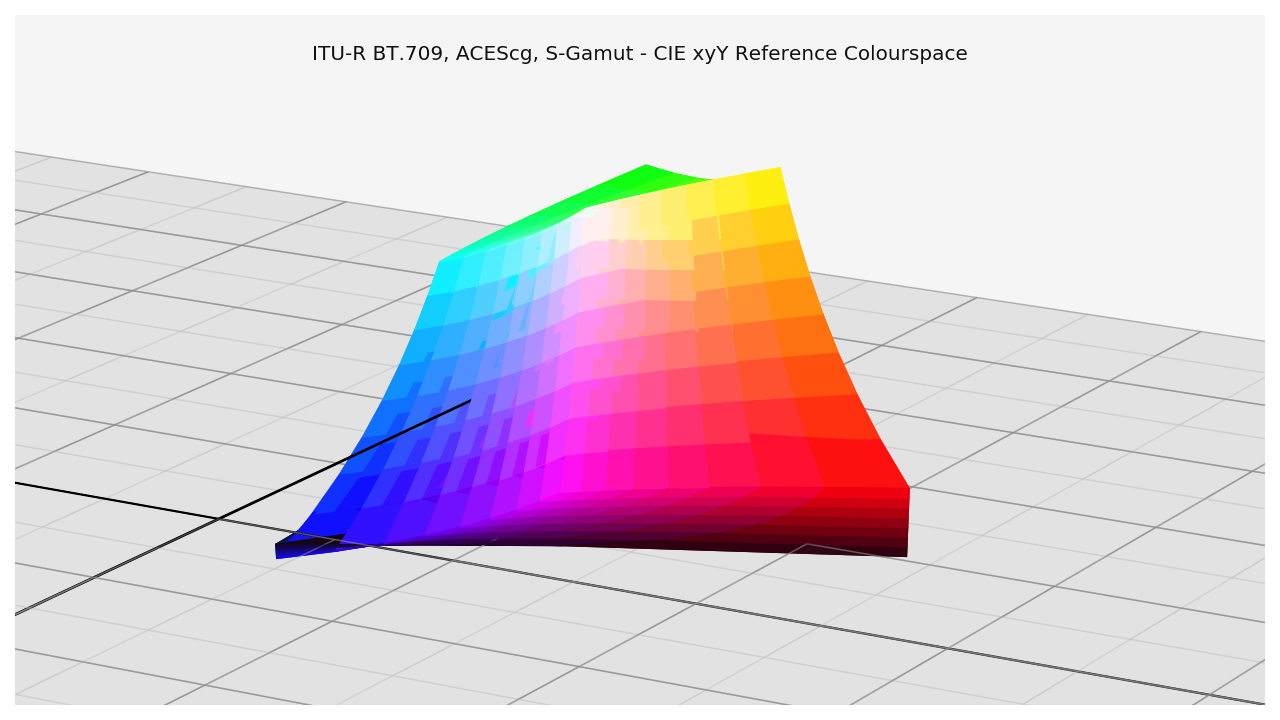
colour.plotting.plot_RGB_colourspaces_gamuts(colourspaces=None, reference_colourspace='CIE xyY', segments=8, show_grid=True, grid_segments=10, show_spectral_locus=False, spectral_locus_colour=None, cmfs='CIE 1931 2 Degree Standard Observer', **kwargs)[source]¶ Plots given RGB colourspaces gamuts in given reference colourspace.
- Parameters
colourspaces (array_like, optional) – RGB colourspaces to plot the gamuts.
reference_colourspace (unicode, optional) – {‘CIE XYZ’, ‘CIE xyY’, ‘CIE xy’, ‘CIE Lab’, ‘CIE LCHab’, ‘CIE Luv’, ‘CIE Luv uv’, ‘CIE LCHuv’, ‘CIE UCS’, ‘CIE UCS uv’, ‘CIE UVW’, ‘DIN 99’, ‘Hunter Lab’, ‘Hunter Rdab’, ‘IPT’, ‘JzAzBz’, ‘OSA UCS’, ‘hdr-CIELAB’, ‘hdr-IPT’}, Reference colourspace to plot the gamuts into.
segments (int, optional) – Edge segments count for each RGB colourspace cubes.
show_grid (bool, optional) – Whether to show a grid at the bottom of the RGB colourspace cubes.
grid_segments (bool, optional) – Edge segments count for the grid.
show_spectral_locus (bool, optional) – Whether to show the spectral locus.
spectral_locus_colour (array_like, optional) – Spectral locus colour.
cmfs (unicode, optional) – Standard observer colour matching functions used for spectral locus.
- Other Parameters
**kwargs (dict, optional) – {
colour.plotting.artist(),colour.plotting.volume.nadir_grid()}, Please refer to the documentation of the previously listed definitions.face_colours (array_like, optional) – Face colours array such as face_colours = (None, (0.5, 0.5, 1.0)).
edge_colours (array_like, optional) – Edge colours array such as edge_colours = (None, (0.5, 0.5, 1.0)).
face_alpha (numeric, optional) – Face opacity value such as face_alpha = (0.5, 1.0).
edge_alpha (numeric, optional) – Edge opacity value such as edge_alpha = (0.0, 1.0).
- Returns
Current figure and axes.
- Return type
Examples
>>> plot_RGB_colourspaces_gamuts(['ITU-R BT.709', 'ACEScg', 'S-Gamut'])
...
(<Figure size ... with 1 Axes>, <matplotlib.axes._subplots.Axes3DSubplot object at 0x...>)