colour.plotting.plot_planckian_locus_in_chromaticity_diagram_CIE1931
-
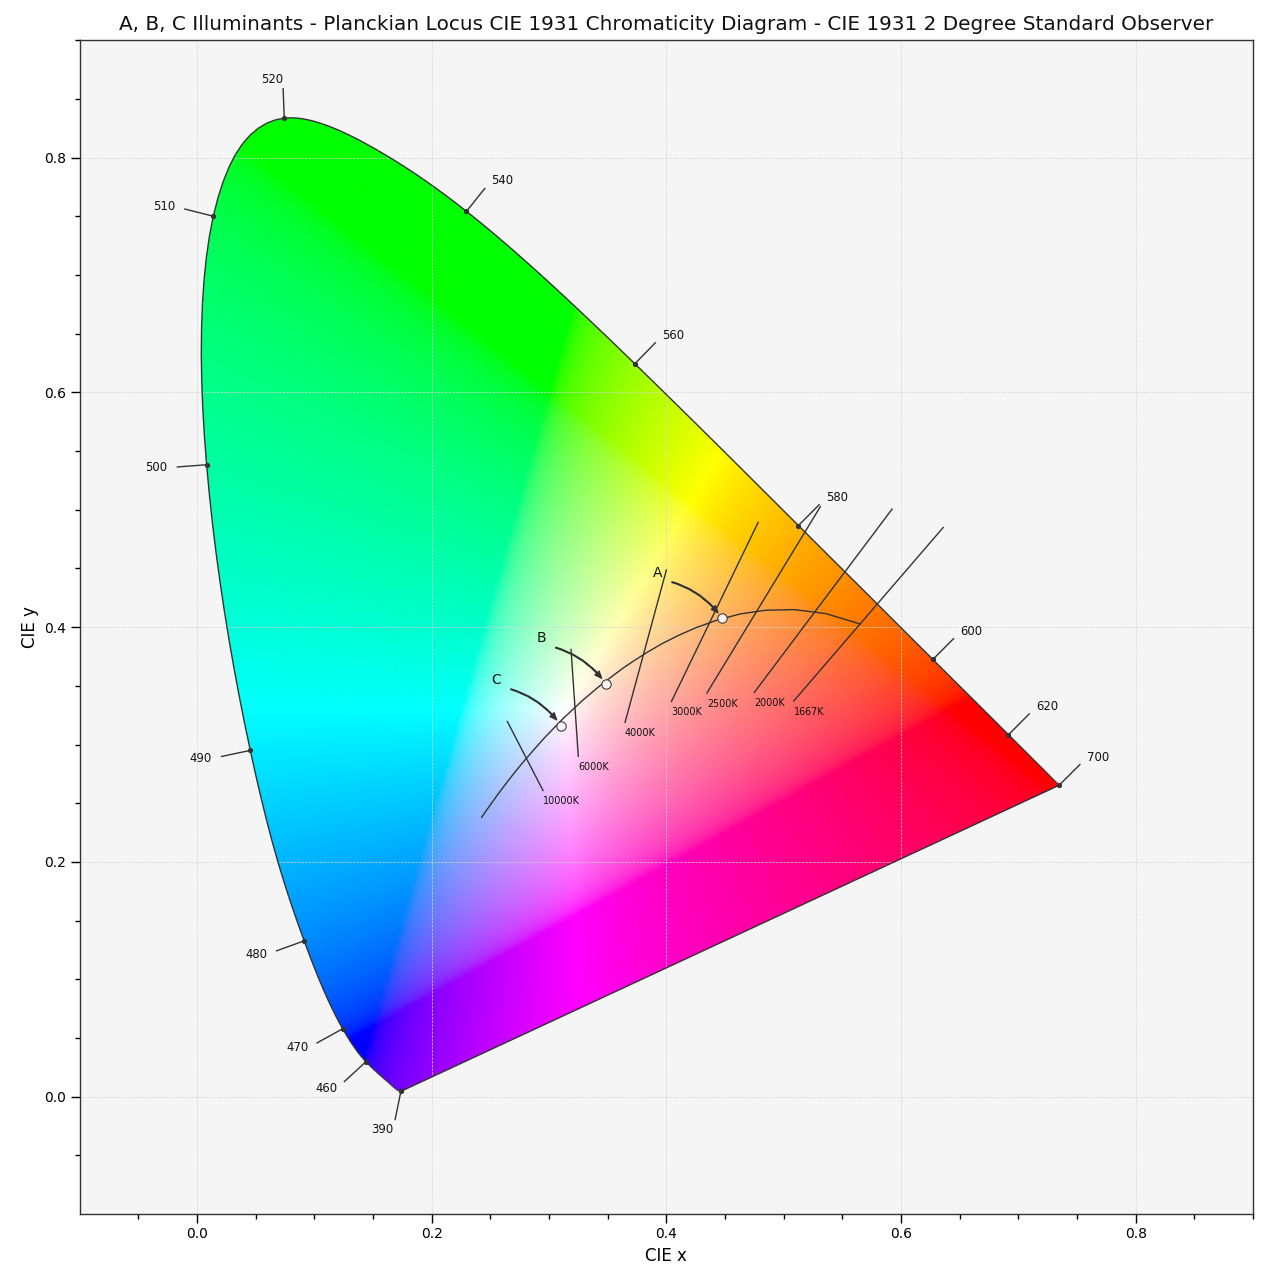
colour.plotting.plot_planckian_locus_in_chromaticity_diagram_CIE1931(illuminants=None, annotate_parameters=None, chromaticity_diagram_callable_CIE1931=<function plot_chromaticity_diagram_CIE1931>, planckian_locus_callable_CIE1931=<function plot_planckian_locus_CIE1931>, **kwargs)[source]¶ Plots the Planckian Locus and given illuminants in CIE 1931 Chromaticity Diagram.
- Parameters
illuminants (array_like, optional) – Factory illuminants to plot.
annotate_parameters (dict or array_like, optional) – Parameters for the
plt.annotate()definition, used to annotate the resulting chromaticity coordinates with their respective illuminant names ifannotateis set to True.annotate_parameterscan be either a single dictionary applied to all the arrows with same settings or a sequence of dictionaries with different settings for each illuminant.chromaticity_diagram_callable_CIE1931 (callable, optional) – Callable responsible for drawing the CIE 1931 Chromaticity Diagram.
planckian_locus_callable_CIE1931 (callable, optional) – Callable responsible for drawing the Planckian Locus according to CIE 1931 method.
- Other Parameters
**kwargs (dict, optional) – {
colour.plotting.artist(),colour.plotting.diagrams.plot_chromaticity_diagram(),colour.plotting.temperature.plot_planckian_locus(),colour.plotting.temperature.plot_planckian_locus_in_chromaticity_diagram(),colour.plotting.render()}, Please refer to the documentation of the previously listed definitions.- Returns
Current figure and axes.
- Return type
Examples
>>> plot_planckian_locus_in_chromaticity_diagram_CIE1931(['A', 'B', 'C'])
...
(<Figure size ... with 1 Axes>, <matplotlib.axes._subplots.AxesSubplot object at 0x...>)