colour.plotting.diagrams.plot_chromaticity_diagram_colours
-
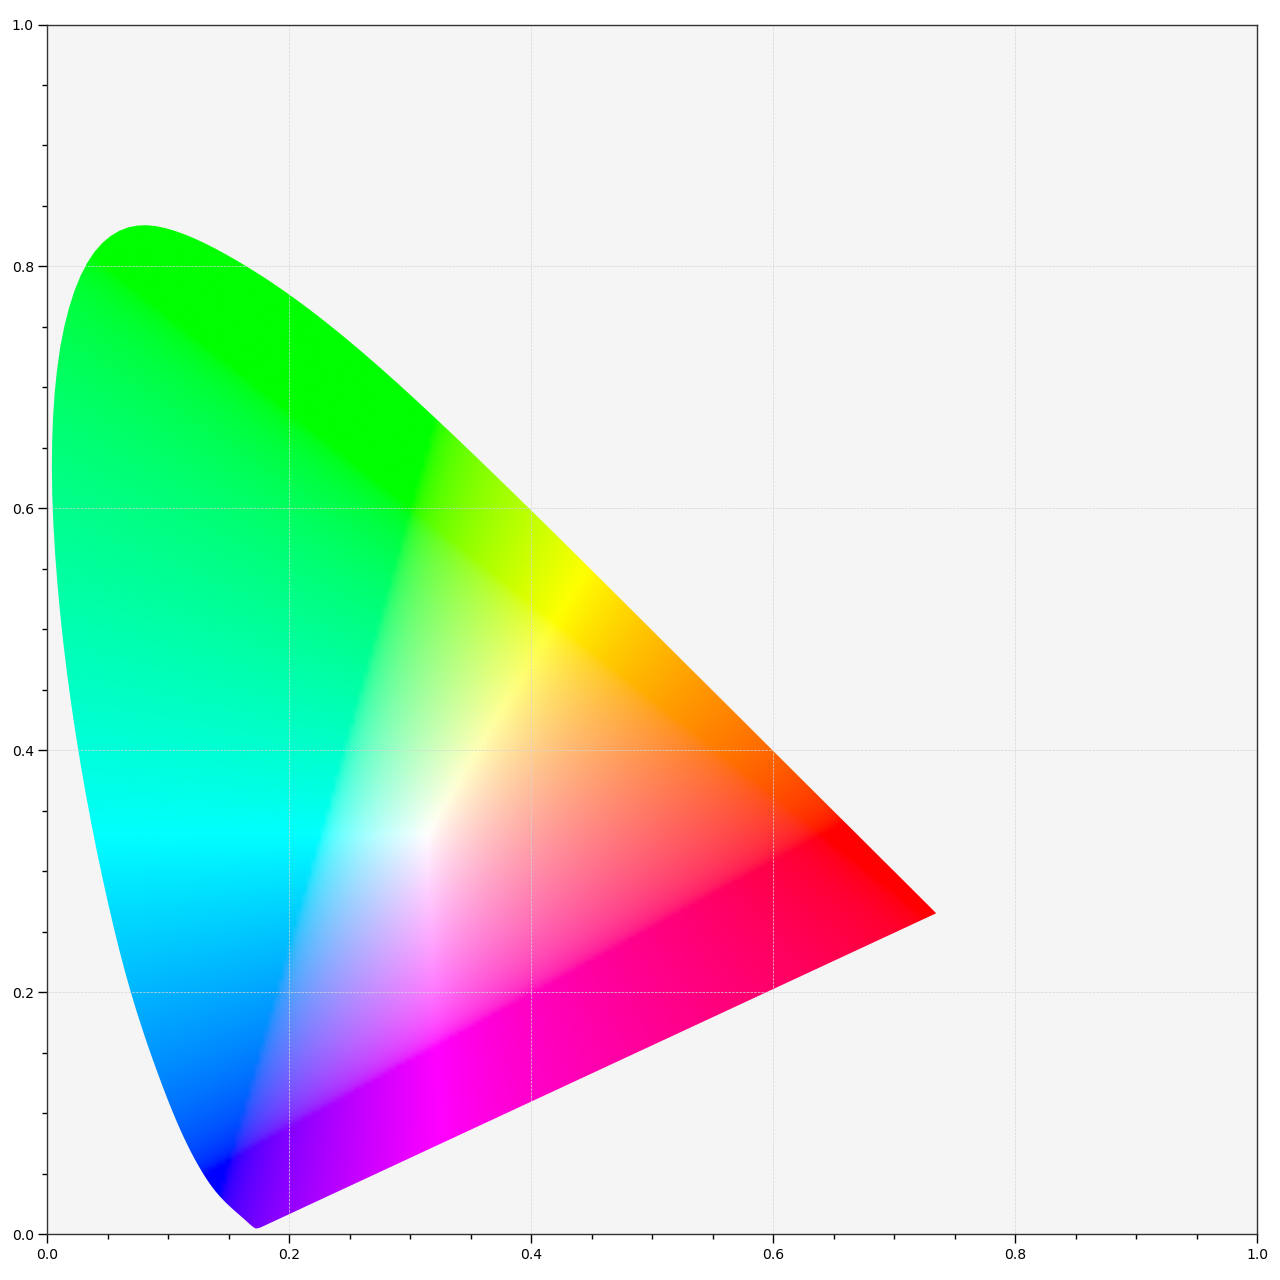
colour.plotting.diagrams.plot_chromaticity_diagram_colours(samples=256, diagram_opacity=1.0, diagram_clipping_path=None, cmfs='CIE 1931 2 Degree Standard Observer', method='CIE 1931', **kwargs)[source]¶ Plots the Chromaticity Diagram colours according to given method.
Parameters: - samples (numeric, optional) – Samples count on one axis.
- diagram_opacity (numeric, optional) – Opacity of the Chromaticity Diagram colours.
- diagram_clipping_path (array_like, optional) – Path of points used to clip the Chromaticity Diagram colours.
- cmfs (unicode, optional) – Standard observer colour matching functions used for Chromaticity Diagram bounds.
- method (unicode, optional) – {‘CIE 1931’, ‘CIE 1960 UCS’, ‘CIE 1976 UCS’}, Chromaticity Diagram method.
Other Parameters: **kwargs (dict, optional) – {
colour.plotting.artist(),colour.plotting.render()}, Please refer to the documentation of the previously listed definitions.Returns: Current figure and axes.
Return type: Examples
>>> plot_chromaticity_diagram_colours() # doctest: +SKIP