colour.plotting.diagrams.plot_sds_in_chromaticity_diagram
-
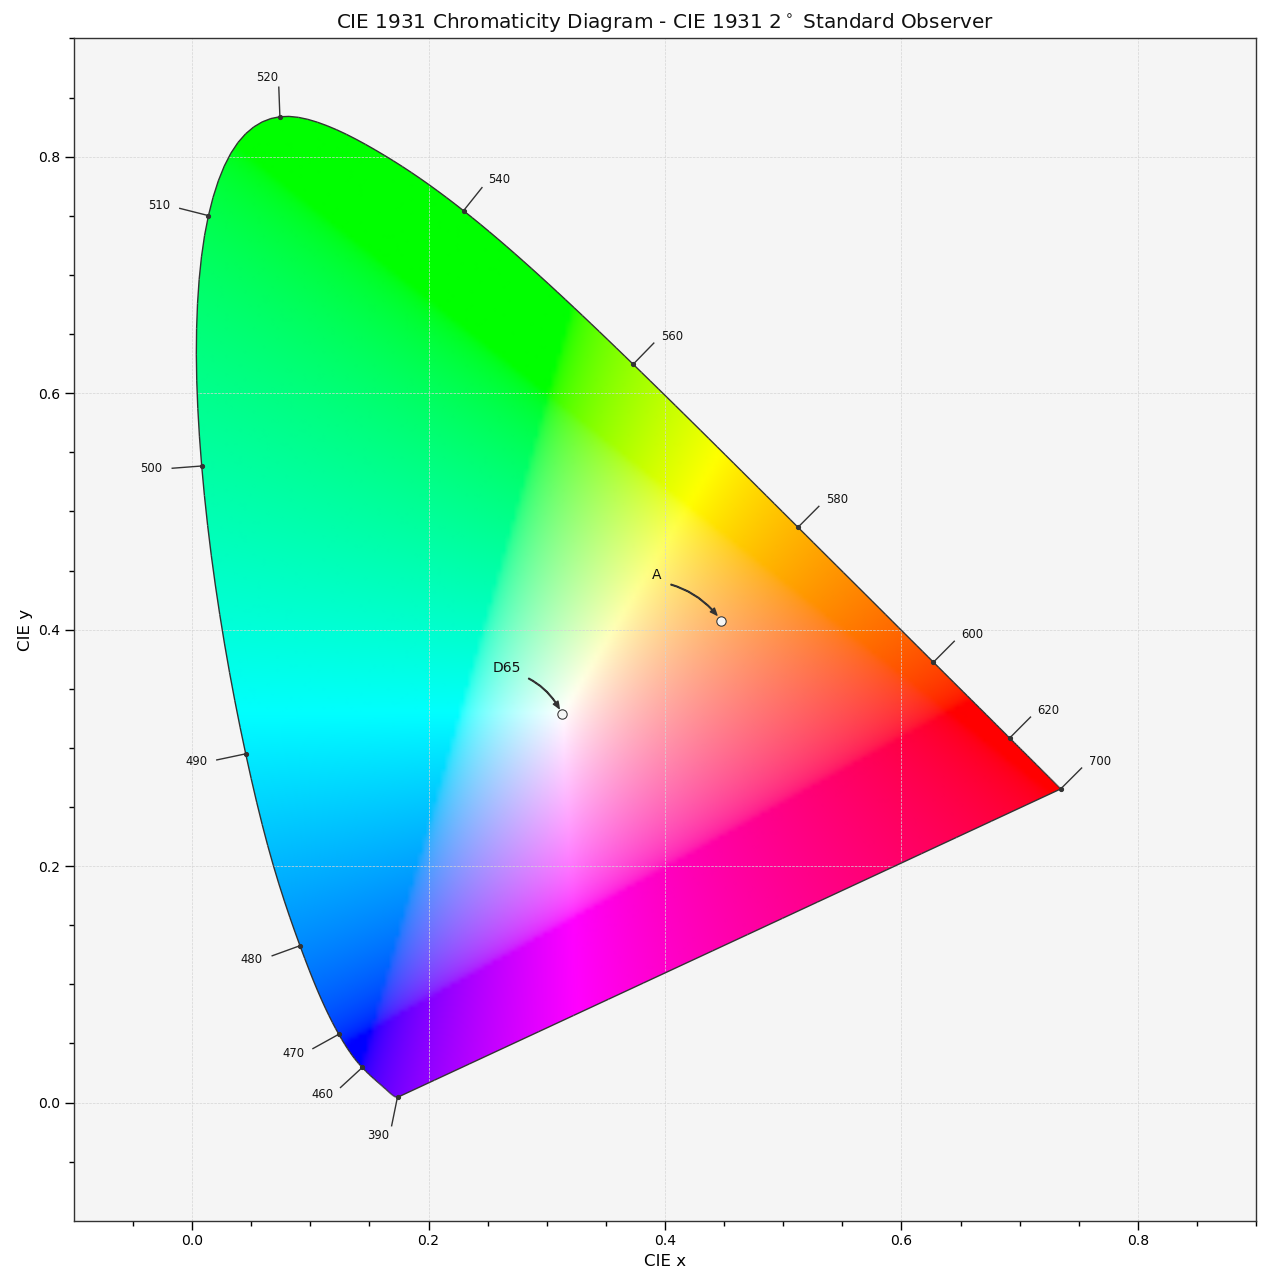
colour.plotting.diagrams.plot_sds_in_chromaticity_diagram(sds, cmfs='CIE 1931 2 Degree Standard Observer', annotate_parameters=None, chromaticity_diagram_callable=<function plot_chromaticity_diagram>, method='CIE 1931', **kwargs)[source]¶ Plots given spectral distribution chromaticity coordinates into the Chromaticity Diagram using given method.
Parameters: - sds (array_like, optional) – Spectral distributions to plot.
- cmfs (unicode, optional) – Standard observer colour matching functions used for Chromaticity Diagram bounds.
- annotate_parameters (dict or array_like, optional) – Parameters for the
plt.annotate()definition, used to annotate the resulting chromaticity coordinates with their respective spectral distribution names ifannotateis set to True.annotate_parameterscan be either a single dictionary applied to all the arrows with same settings or a sequence of dictionaries with different settings for each spectral distribution. - chromaticity_diagram_callable (callable, optional) – Callable responsible for drawing the Chromaticity Diagram.
- method (unicode, optional) – {‘CIE 1931’, ‘CIE 1960 UCS’, ‘CIE 1976 UCS’}, Chromaticity Diagram method.
Other Parameters: **kwargs (dict, optional) – {
colour.plotting.artist(),colour.plotting.diagrams.plot_chromaticity_diagram(),colour.plotting.render()}, Please refer to the documentation of the previously listed definitions.Returns: Current figure and axes.
Return type: Examples
>>> from colour import ILLUMINANTS_SDS
>>> A = ILLUMINANTS_SDS['A']
>>> D65 = ILLUMINANTS_SDS['D65']
>>> plot_sds_in_chromaticity_diagram([A, D65])  # doctest: +SKIP