colour.plotting.plot_blackbody_colours
-
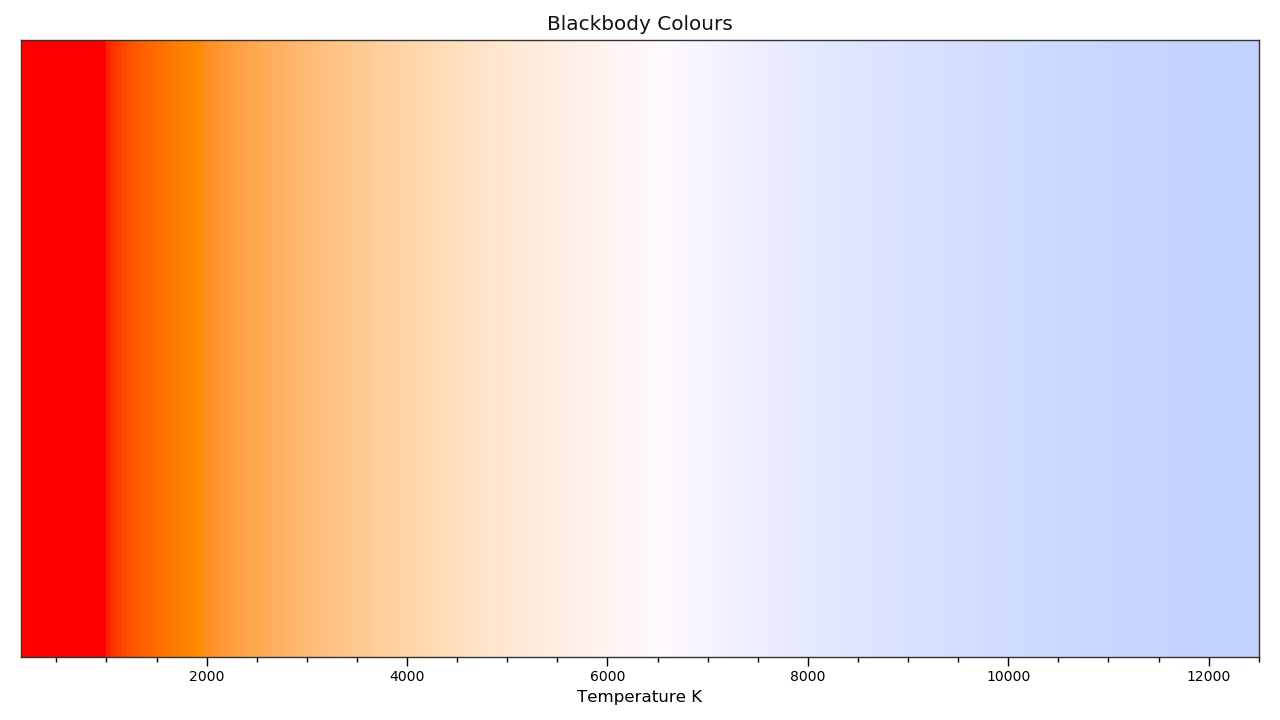
colour.plotting.plot_blackbody_colours(shape=SpectralShape(150, 12500, 50), cmfs='CIE 1931 2 Degree Standard Observer', **kwargs)[source]¶ Plots blackbody colours.
Parameters: - shape (SpectralShape, optional) – Spectral shape to use as plot boundaries.
- cmfs (unicode, optional) – Standard observer colour matching functions.
Other Parameters: **kwargs (dict, optional) – {
colour.plotting.artist(),colour.plotting.render()}, Please refer to the documentation of the previously listed definitions.Returns: Current figure and axes.
Return type: Examples
>>> plot_blackbody_colours(SpectralShape(150, 12500, 50)) # doctest: +SKIP