colour.plotting.plot_chromaticity_diagram_CIE1960UCS
-
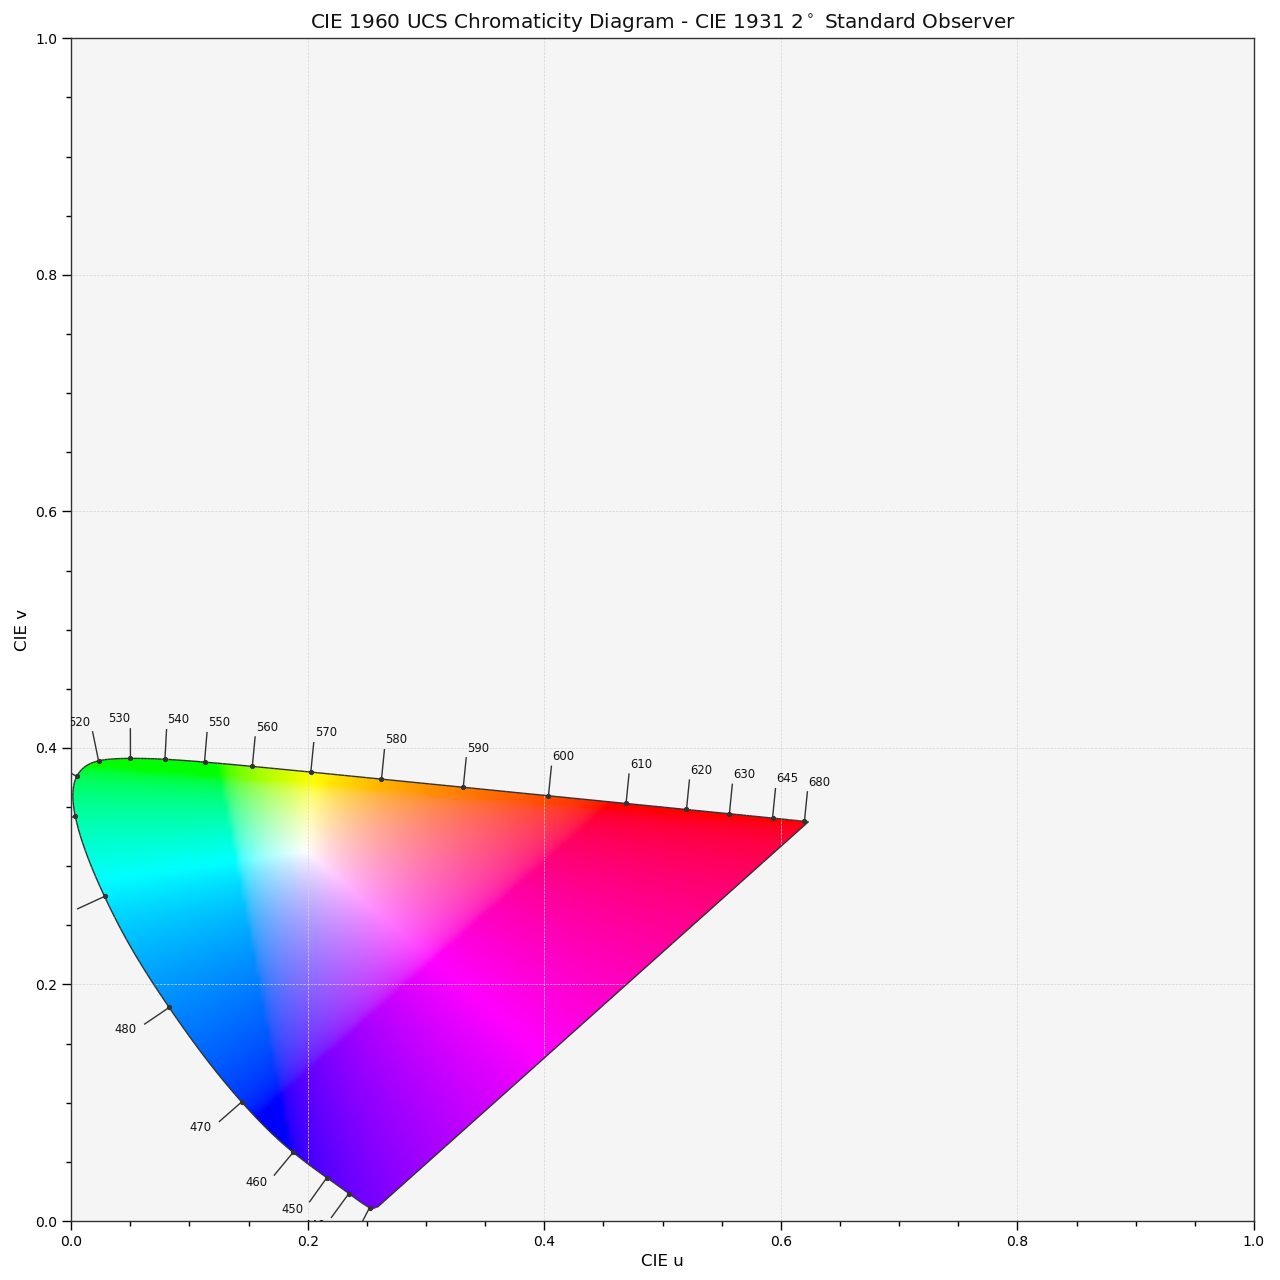
colour.plotting.plot_chromaticity_diagram_CIE1960UCS(cmfs='CIE 1931 2 Degree Standard Observer', show_diagram_colours=True, show_spectral_locus=True, **kwargs)[source]¶ Plots the CIE 1960 UCS Chromaticity Diagram.
Parameters: Other Parameters: **kwargs (dict, optional) – {
colour.plotting.artist(),colour.plotting.diagrams.plot_chromaticity_diagram(),colour.plotting.render()}, Please refer to the documentation of the previously listed definitions.Returns: Current figure and axes.
Return type: Examples
>>> plot_chromaticity_diagram_CIE1960UCS() # doctest: +SKIP