colour.plotting.plot_ellipses_MacAdam1942_in_chromaticity_diagram_CIE1960UCS
-
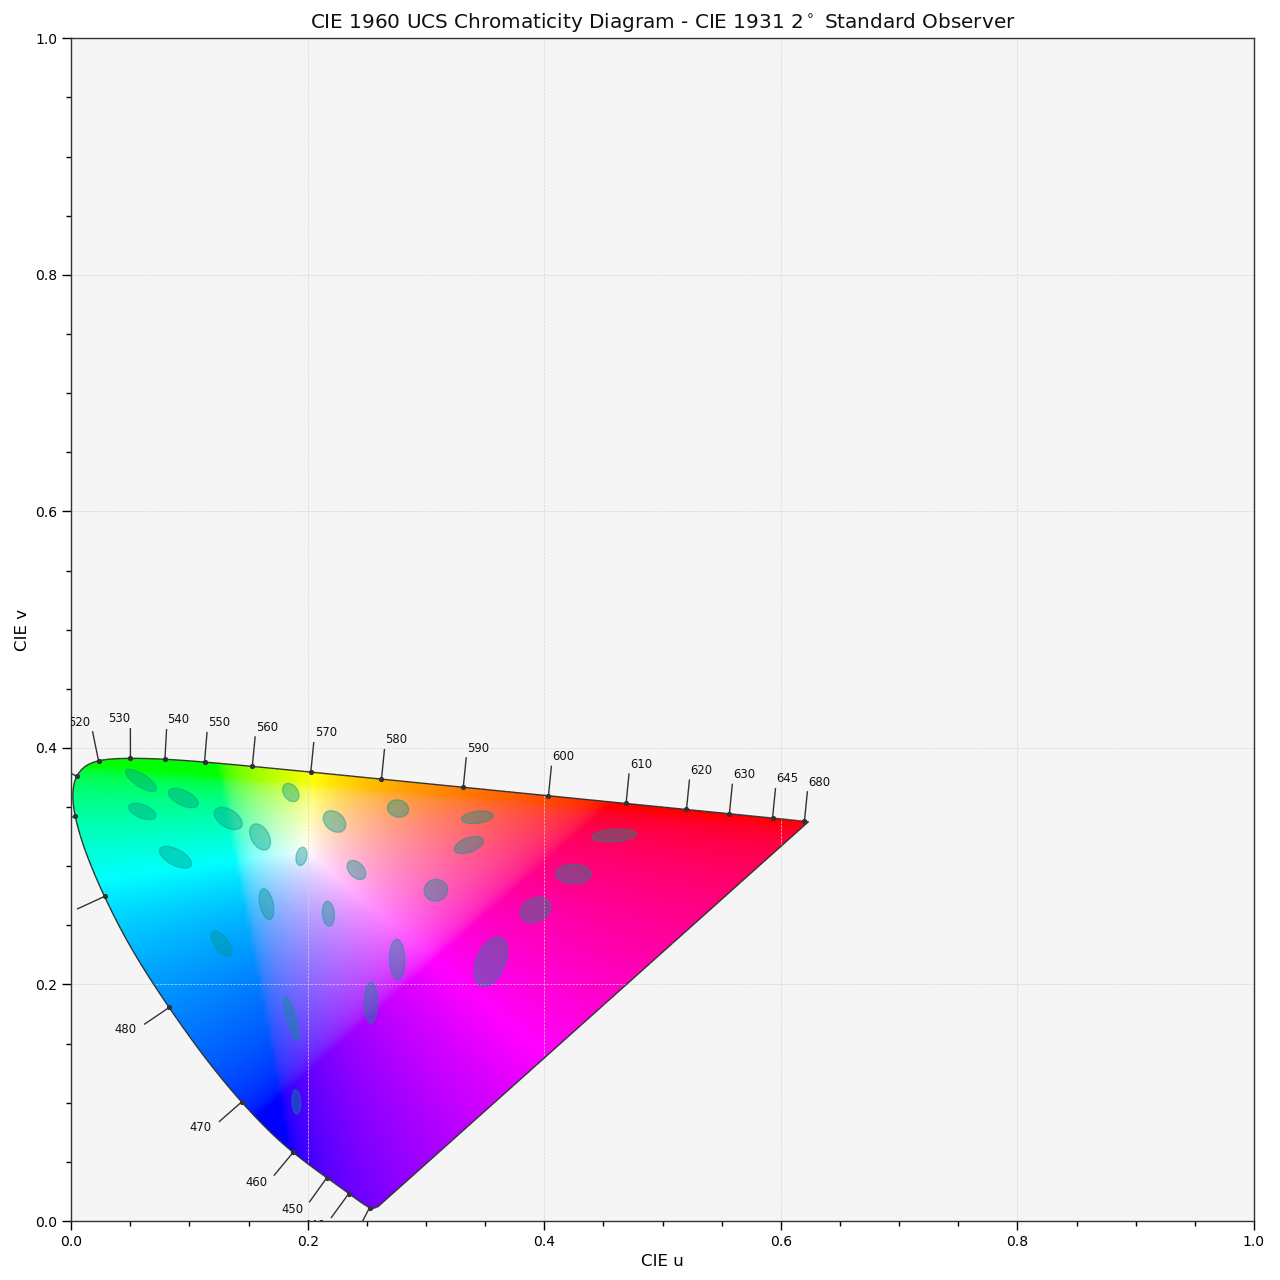
colour.plotting.plot_ellipses_MacAdam1942_in_chromaticity_diagram_CIE1960UCS(chromaticity_diagram_callable_CIE1960UCS=<function plot_chromaticity_diagram_CIE1960UCS>, chromaticity_diagram_clipping=False, ellipse_parameters=None, **kwargs)[source]¶ Plots MacAdam (1942) Ellipses (Observer PGN) in the CIE 1960 UCS Chromaticity Diagram.
Parameters: - chromaticity_diagram_callable_CIE1960UCS (callable, optional) – Callable responsible for drawing the CIE 1960 UCS Chromaticity Diagram.
- chromaticity_diagram_clipping (bool, optional,) – Whether to clip the CIE 1960 UCS Chromaticity Diagram colours with the ellipses.
- ellipse_parameters (dict or array_like, optional) – Parameters for the
Ellipseclass,ellipse_parameterscan be either a single dictionary applied to all the ellipses with same settings or a sequence of dictionaries with different settings for each ellipse.
Other Parameters: **kwargs (dict, optional) – {
colour.plotting.artist(),colour.plotting.diagrams.plot_chromaticity_diagram(),colour.plotting.models.plot_ellipses_MacAdam1942_in_chromaticity_diagram()},colour.plotting.render()}, Please refer to the documentation of the previously listed definitions.Returns: Current figure and axes.
Return type: Examples
>>> plot_ellipses_MacAdam1942_in_chromaticity_diagram_CIE1960UCS()
... # doctest: +SKIP