colour.plotting.plot_single_sd_rayleigh_scattering
-
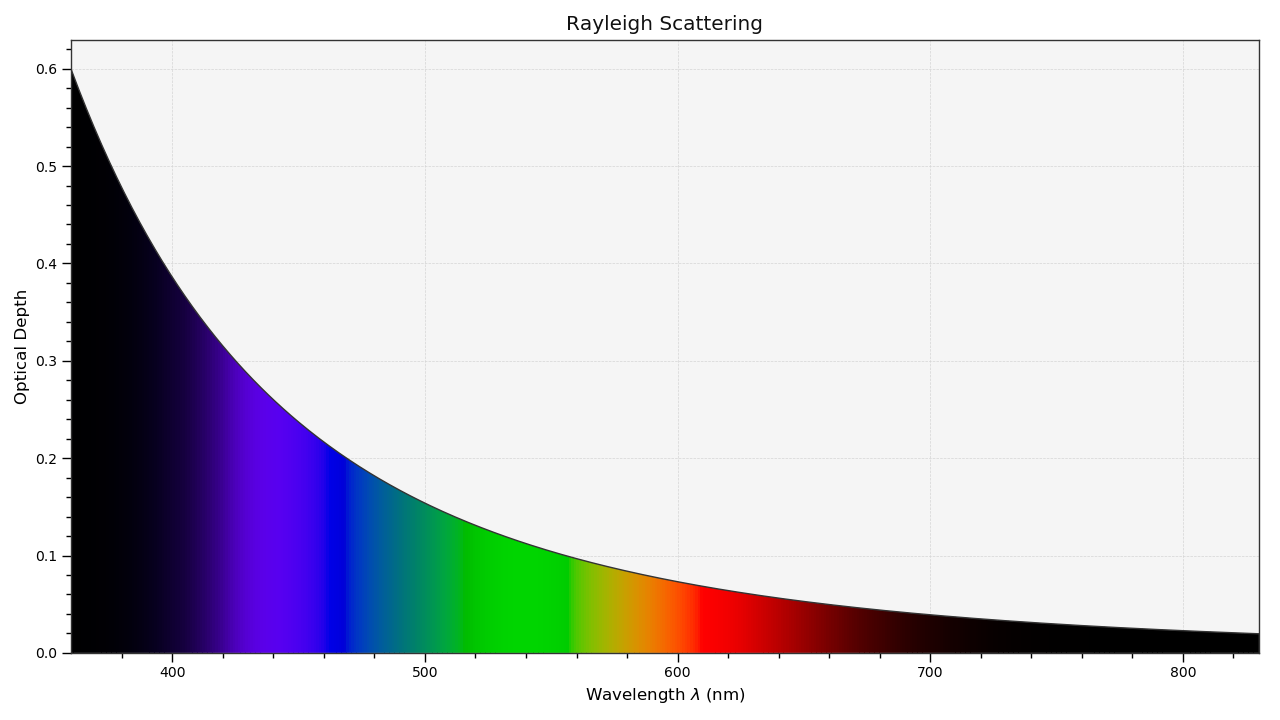
colour.plotting.plot_single_sd_rayleigh_scattering(CO2_concentration=300, temperature=288.15, pressure=101325, latitude=0, altitude=0, cmfs='CIE 1931 2 Degree Standard Observer', **kwargs)[source]¶ Plots a single Rayleigh scattering spectral distribution.
Parameters: - CO2_concentration (numeric, optional) – \(CO_2\) concentration in parts per million (ppm).
- temperature (numeric, optional) – Air temperature \(T[K]\) in kelvin degrees.
- pressure (numeric) – Surface pressure \(P\) of the measurement site.
- latitude (numeric, optional) – Latitude of the site in degrees.
- altitude (numeric, optional) – Altitude of the site in meters.
- cmfs (unicode, optional) – Standard observer colour matching functions.
Other Parameters: - **kwargs (dict, optional) – {
colour.plotting.artist(),colour.plotting.plot_single_sd(),colour.plotting.render()}, Please refer to the documentation of the previously listed definitions. - out_of_gamut_clipping (bool, optional) – {
colour.plotting.plot_single_sd()}, Whether to clip out of gamut colours otherwise, the colours will be offset by the absolute minimal colour leading to a rendering on gray background, less saturated and smoother.
Returns: Current figure and axes.
Return type: Examples
>>> plot_single_sd_rayleigh_scattering() # doctest: +SKIP