colour.plotting.plot_multi_sds
-
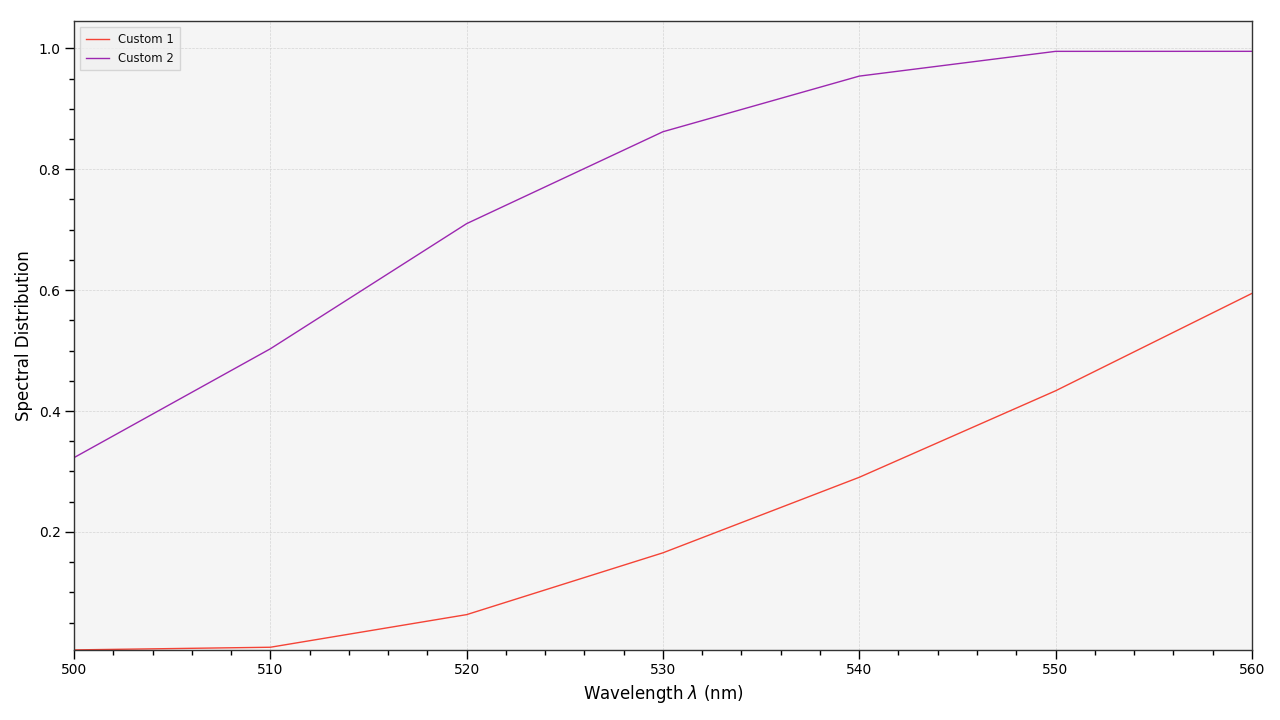
colour.plotting.plot_multi_sds(sds, cmfs='CIE 1931 2 Degree Standard Observer', use_sds_colours=False, normalise_sds_colours=False, **kwargs)[source]¶ Plots given spectral distributions.
- Parameters
sds (array_like or MultiSpectralDistributions) – Spectral distributions or multi-spectral distributions to plot. sds can be a single
colour.MultiSpectralDistributionsclass instance, a list ofcolour.MultiSpectralDistributionsclass instances or a list ofcolour.SpectralDistributionclass instances.cmfs (unicode, optional) – Standard observer colour matching functions used for spectrum creation.
use_sds_colours (bool, optional) – Whether to use spectral distributions colours.
normalise_sds_colours (bool) – Whether to normalise spectral distributions colours.
- Other Parameters
**kwargs (dict, optional) – {
colour.plotting.artist(),colour.plotting.render()}, Please refer to the documentation of the previously listed definitions.- Returns
Current figure and axes.
- Return type
Examples
>>> from colour import SpectralDistribution
>>> data_1 = {
...     500: 0.004900,
...     510: 0.009300,
...     520: 0.063270,
...     530: 0.165500,
...     540: 0.290400,
...     550: 0.433450,
...     560: 0.594500
... }
>>> data_2 = {
...     500: 0.323000,
...     510: 0.503000,
...     520: 0.710000,
...     530: 0.862000,
...     540: 0.954000,
...     550: 0.994950,
...     560: 0.995000
... }
>>> sd_1 = SpectralDistribution(data_1, name='Custom 1')
>>> sd_2 = SpectralDistribution(data_2, name='Custom 2')
>>> plot_multi_sds([sd_1, sd_2])
(<Figure size ... with 1 Axes>, <matplotlib.axes._subplots.AxesSubplot object at 0x...>)