colour.plotting.plot_single_sd
-
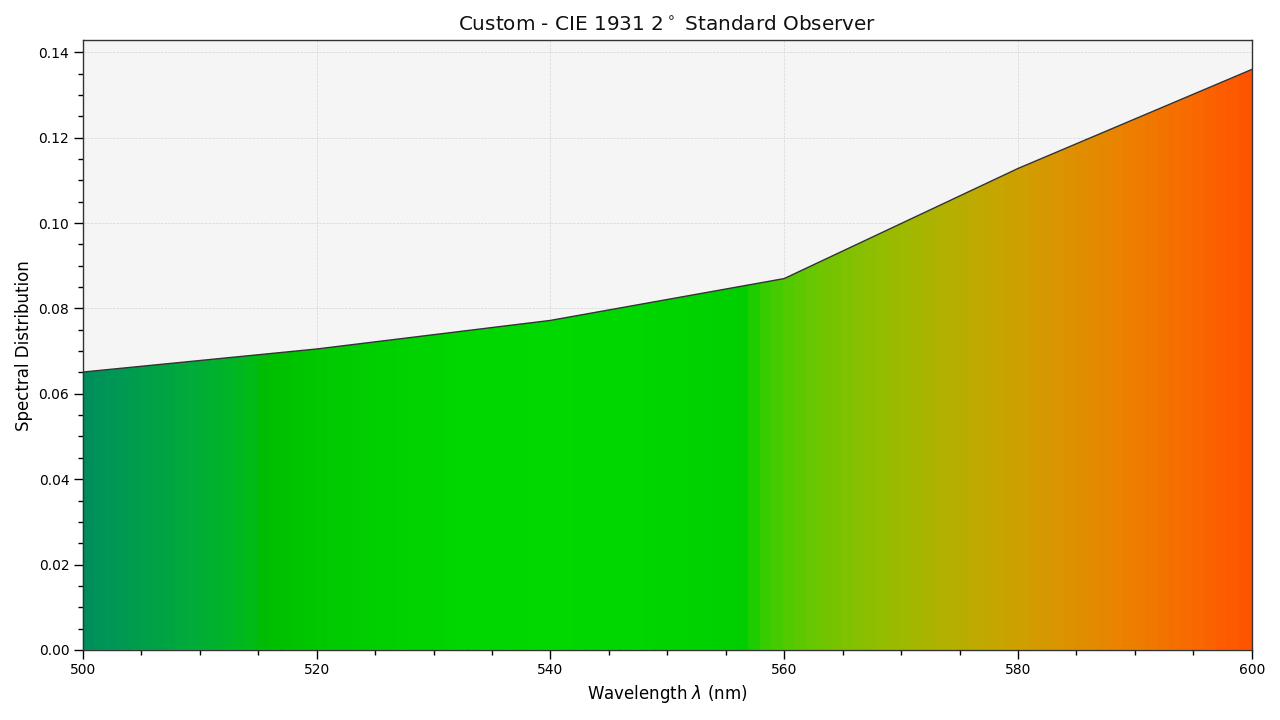
colour.plotting.plot_single_sd(sd, cmfs='CIE 1931 2 Degree Standard Observer', out_of_gamut_clipping=True, modulate_colours_with_sd_amplitude=False, equalize_sd_amplitude=False, **kwargs)[source]¶ Plots given spectral distribution.
- Parameters
sd (SpectralDistribution) – Spectral distribution to plot.
out_of_gamut_clipping (bool, optional) – Whether to clip out of gamut colours otherwise, the colours will be offset by the absolute minimal colour leading to a rendering on gray background, less saturated and smoother.
modulate_colours_with_sd_amplitude (bool, optional) – Whether to modulate the colours with the spectral distribution amplitude.
equalize_sd_amplitude (bool, optional) – Whether to equalize the spectral distribution amplitude. Equalization occurs after the colours modulation thus setting both arguments to True will generate a spectrum strip where each wavelength colour is modulated by the spectral distribution amplitude. The usual 5% margin above the spectral distribution is also omitted.
cmfs (unicode) – Standard observer colour matching functions used for spectrum creation.
- Other Parameters
**kwargs (dict, optional) – {
colour.plotting.artist(),colour.plotting.render()}, Please refer to the documentation of the previously listed definitions.- Returns
Current figure and axes.
- Return type
References
Examples
>>> from colour import SpectralDistribution
>>> data = {
...     500: 0.0651,
...     520: 0.0705,
...     540: 0.0772,
...     560: 0.0870,
...     580: 0.1128,
...     600: 0.1360
... }
>>> sd = SpectralDistribution(data, name='Custom')
>>> plot_single_sd(sd)
(<Figure size ... with 1 Axes>, <matplotlib.axes._subplots.AxesSubplot object at 0x...>)