colour.plotting.plot_corresponding_chromaticities_prediction
-
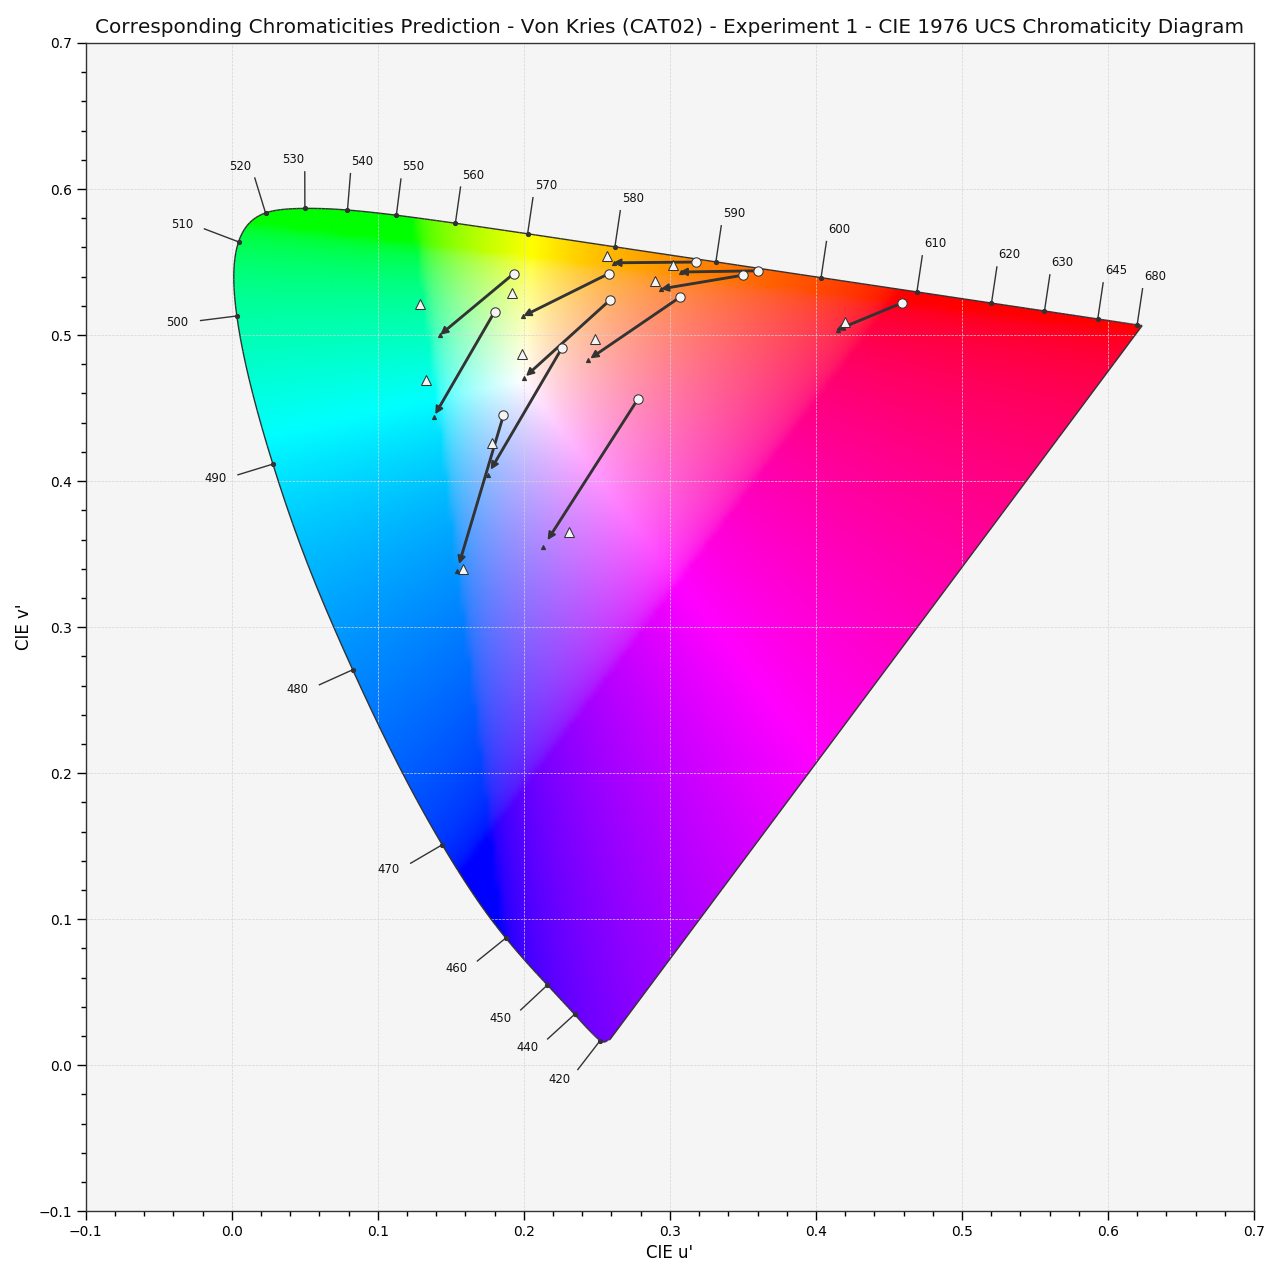
colour.plotting.plot_corresponding_chromaticities_prediction(experiment=1, model='Von Kries', transform='CAT02', **kwargs)[source]¶ Plots given chromatic adaptation model corresponding chromaticities prediction.
- Parameters
experiment (integer or CorrespondingColourDataset, optional) – {1, 2, 3, 4, 6, 8, 9, 11, 12} Breneman (1987) experiment number or
colour.CorrespondingColourDatasetclass instance.model (unicode, optional) – Corresponding chromaticities prediction model name.
transform (unicode, optional) – Transformation to use with Von Kries chromatic adaptation model.
- Other Parameters
**kwargs (dict, optional) – {
colour.plotting.artist(),colour.plotting.diagrams.plot_chromaticity_diagram(),colour.plotting.render()}, Please refer to the documentation of the previously listed definitions.- Returns
Current figure and axes.
- Return type
Examples
>>> plot_corresponding_chromaticities_prediction(1, 'Von Kries', 'CAT02')
...
(<Figure size ... with 1 Axes>, <matplotlib.axes._subplots.AxesSubplot object at 0x...>)