colour.plotting.plot_multi_sds_colour_rendering_indexes_bars
-
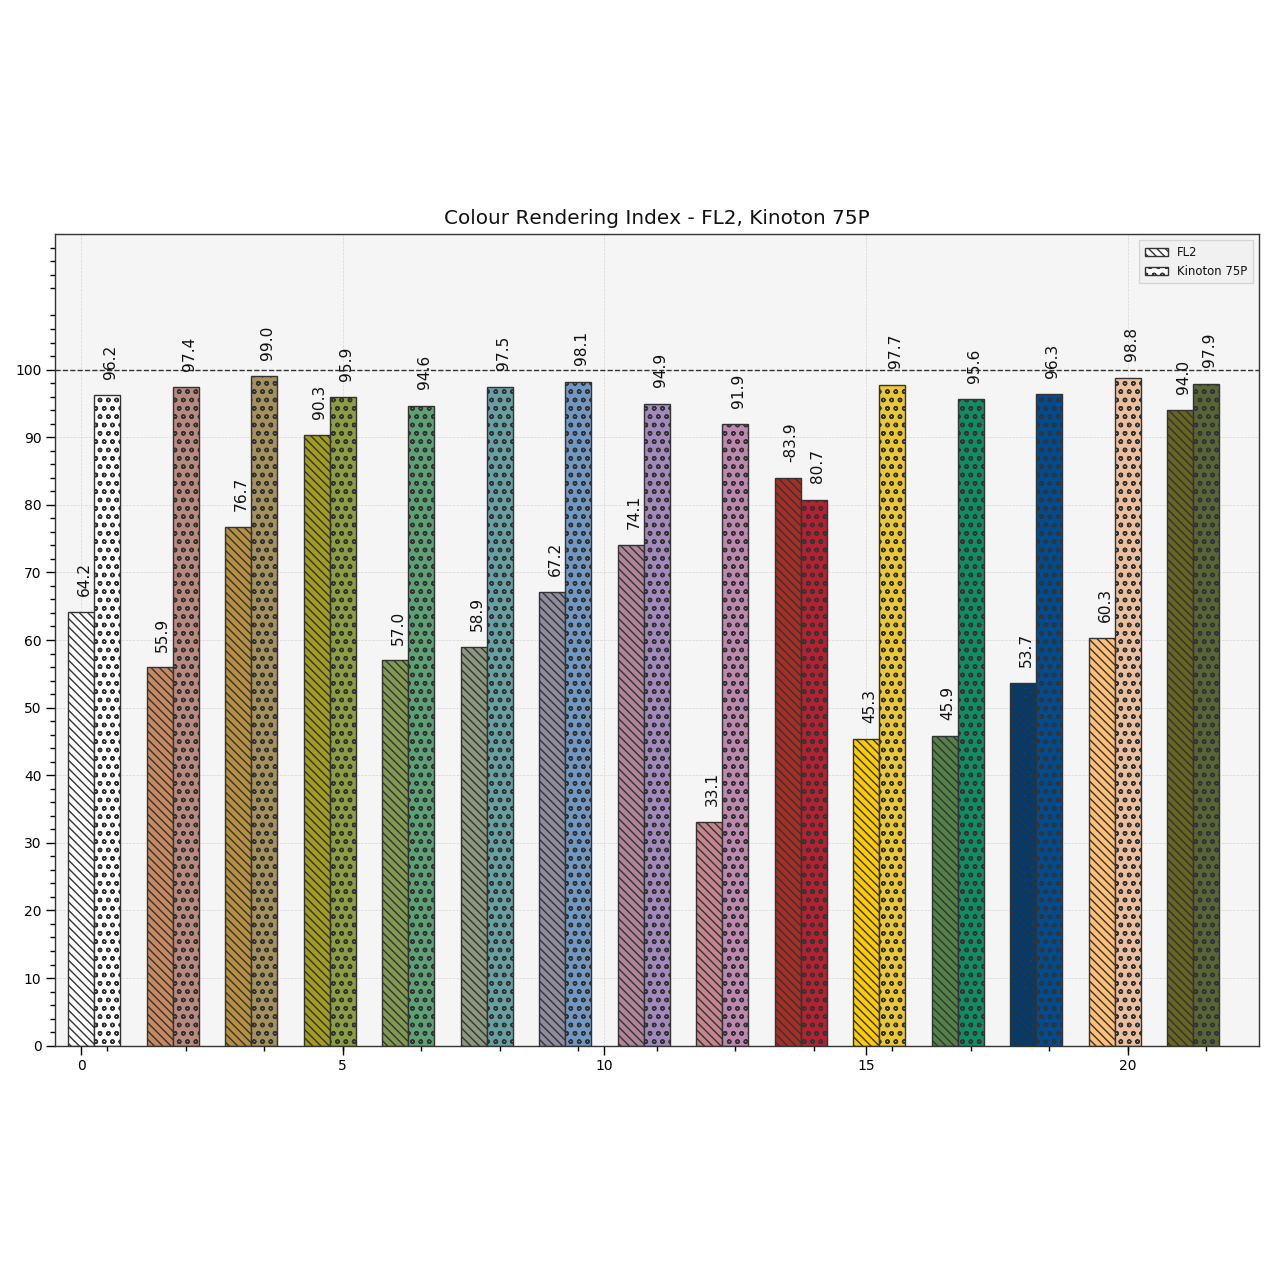
colour.plotting.plot_multi_sds_colour_rendering_indexes_bars(sds, **kwargs)[source]¶ Plots the Colour Rendering Index (CRI) of given illuminants or light sources spectral distributions.
- Parameters
sds (array_like or MultiSpectralDistributions) – Spectral distributions or multi-spectral distributions to plot. sds can be a single
colour.MultiSpectralDistributionsclass instance, a list ofcolour.MultiSpectralDistributionsclass instances or a list ofcolour.SpectralDistributionclass instances.- Other Parameters
**kwargs (dict, optional) – {
colour.plotting.artist(),colour.plotting.quality.plot_colour_quality_bars(),colour.plotting.render()}, Please refer to the documentation of the previously listed definitions.labels (bool, optional) – {
colour.plotting.quality.plot_colour_quality_bars()}, Add labels above bars.hatching (bool or None, optional) – {
colour.plotting.quality.plot_colour_quality_bars()}, Use hatching for the bars.hatching_repeat (int, optional) – {
colour.plotting.quality.plot_colour_quality_bars()}, Hatching pattern repeat.
- Returns
Current figure and axes.
- Return type
Examples
>>> from colour import (ILLUMINANTS_SDS,
...                     LIGHT_SOURCES_SDS)
>>> illuminant = ILLUMINANTS_SDS['FL2']
>>> light_source = LIGHT_SOURCES_SDS['Kinoton 75P']
>>> plot_multi_sds_colour_rendering_indexes_bars(
...     [illuminant, light_source])
(<Figure size ... with 1 Axes>, <matplotlib.axes._subplots.AxesSubplot object at 0x...>)