colour.plotting.plot_single_illuminant_sd
-
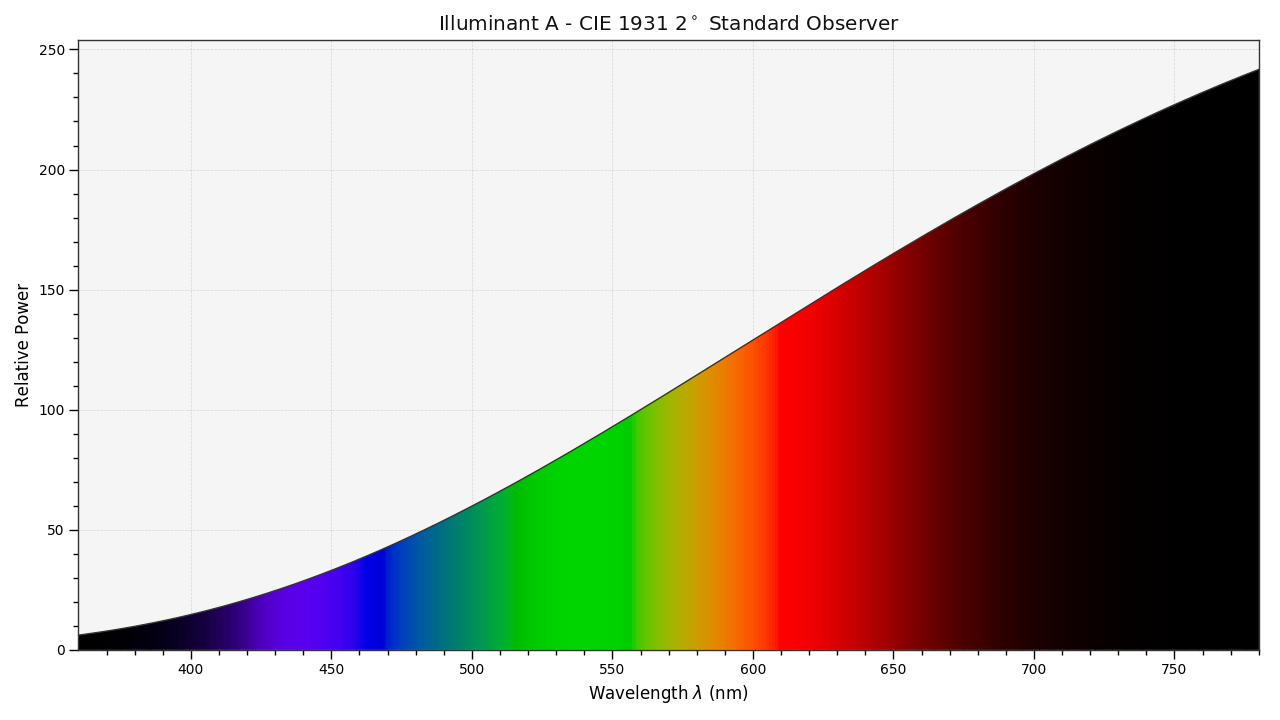
colour.plotting.plot_single_illuminant_sd(illuminant='A', cmfs='CIE 1931 2 Degree Standard Observer', **kwargs)[source]¶ Plots given single illuminant spectral distribution.
- Parameters
illuminant (unicode, optional) – Factory illuminant to plot.
cmfs (unicode, optional) – Standard observer colour matching functions to plot.
- Other Parameters
**kwargs (dict, optional) – {
colour.plotting.artist(),colour.plotting.plot_single_sd(),colour.plotting.render()}, Please refer to the documentation of the previously listed definitions.out_of_gamut_clipping (bool, optional) – {
colour.plotting.plot_single_sd()}, Whether to clip out of gamut colours otherwise, the colours will be offset by the absolute minimal colour leading to a rendering on gray background, less saturated and smoother.
- Returns
Current figure and axes.
- Return type
References
Examples
>>> plot_single_illuminant_sd('A')
(<Figure size ... with 1 Axes>, <matplotlib.axes._subplots.AxesSubplot object at 0x...>)