colour.plotting.quality.plot_colour_quality_bars
- colour.plotting.quality.plot_colour_quality_bars(specifications, labels=True, hatching=None, hatching_repeat=2, **kwargs)[source]
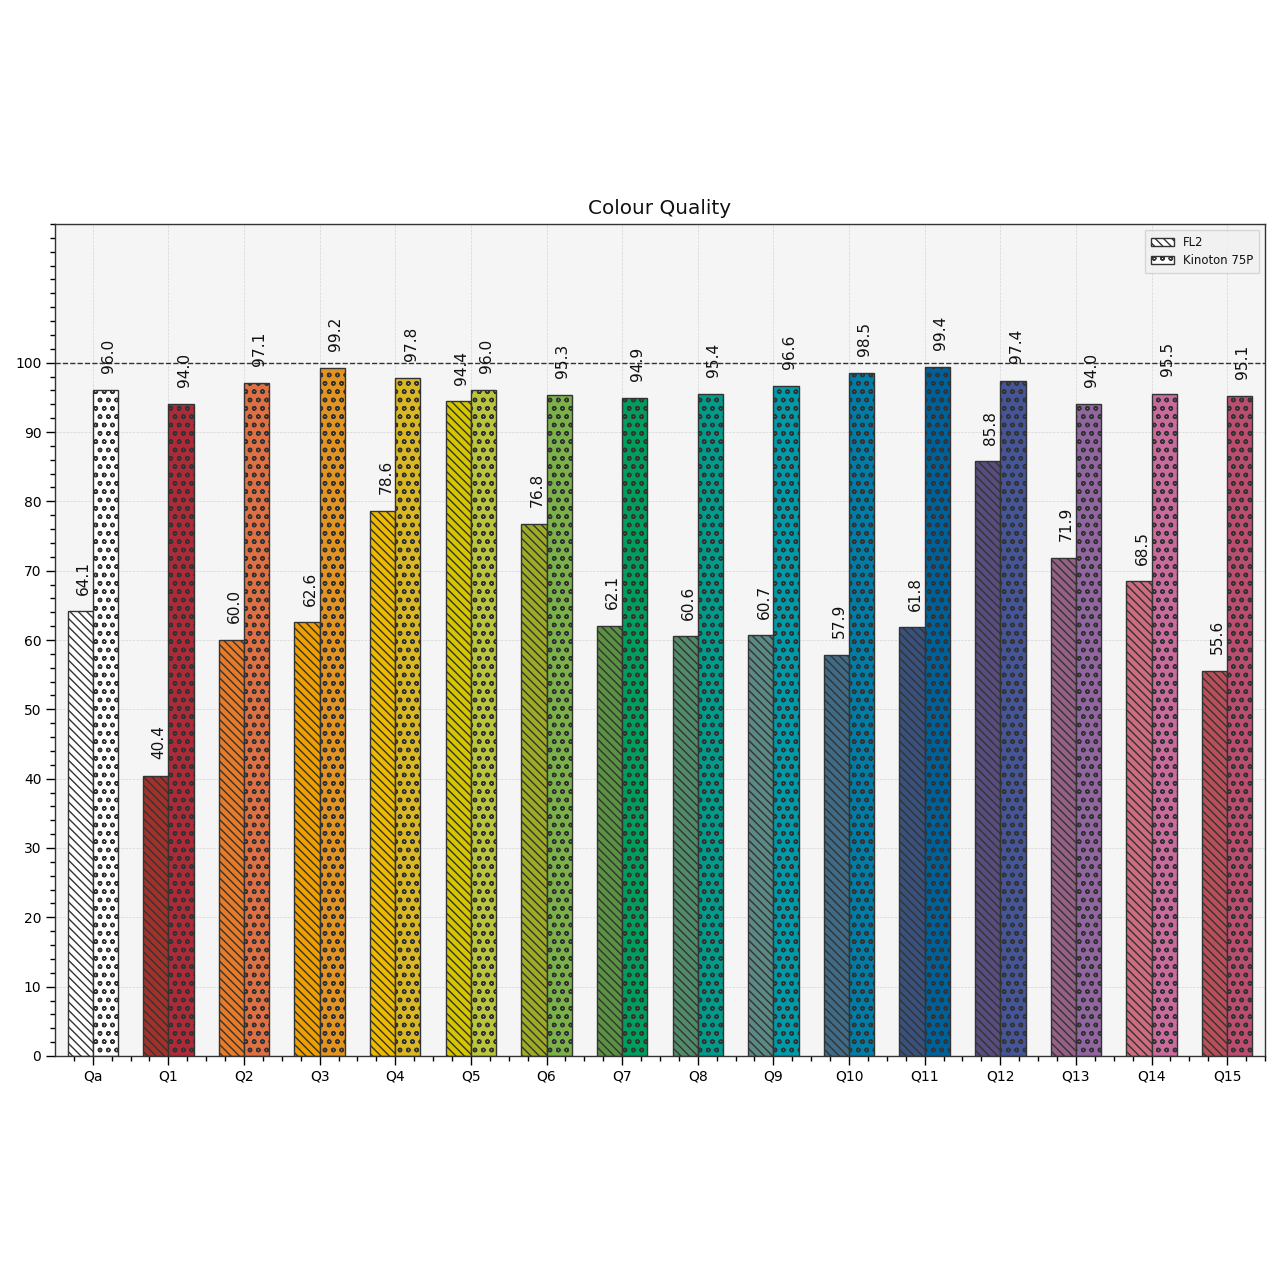
Plots the colour quality data of given illuminants or light sources colour quality specifications.
- Parameters
specifications (array_like) – Array of illuminants or light sources colour quality specifications.
labels (bool, optional) – Add labels above bars.
hatching (bool or None, optional) – Use hatching for the bars.
hatching_repeat (int, optional) – Hatching pattern repeat.
**kwargs (dict, optional) – {
colour.plotting.artist(),colour.plotting.quality.plot_colour_quality_bars(),colour.plotting.render()}, Please refer to the documentation of the previously listed definitions.
- Returns
Current figure and axes.
- Return type
Examples
>>> from colour import (SDS_ILLUMINANTS,
...                     SDS_LIGHT_SOURCES, SpectralShape)
>>> illuminant = SDS_ILLUMINANTS['FL2']
>>> light_source = SDS_LIGHT_SOURCES['Kinoton 75P']
>>> light_source = light_source.copy().align(SpectralShape(360, 830, 1))
>>> cqs_i = colour_quality_scale(illuminant, additional_data=True)
>>> cqs_l = colour_quality_scale(light_source, additional_data=True)
>>> plot_colour_quality_bars([cqs_i, cqs_l])
(<Figure size ... with 1 Axes>, <...AxesSubplot...>)