colour.plotting.models.plot_RGB_chromaticities_in_chromaticity_diagram
- colour.plotting.models.plot_RGB_chromaticities_in_chromaticity_diagram(RGB, colourspace='sRGB', chromaticity_diagram_callable=<function plot_RGB_colourspaces_in_chromaticity_diagram>, method='CIE 1931', scatter_kwargs=None, **kwargs)[source]
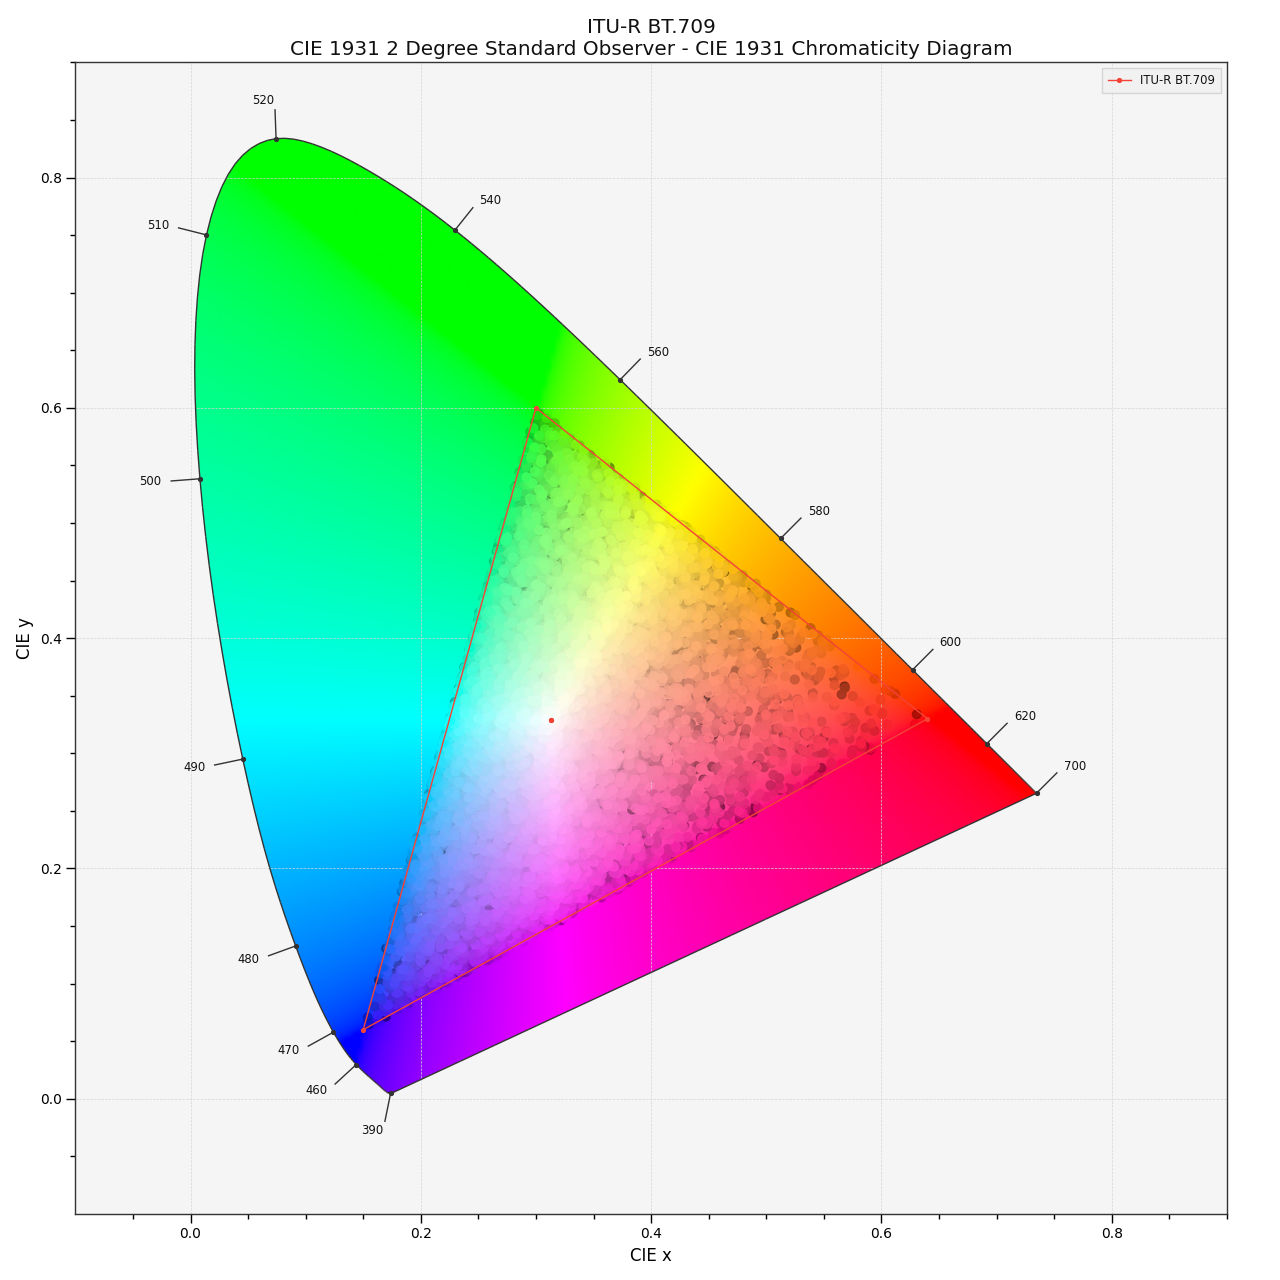
Plots given RGB colourspace array in the Chromaticity Diagram according to given method.
- Parameters
RGB (array_like) – RGB colourspace array.
colourspace (unicode or RGB_Colourspace, optional) – RGB colourspace of the RGB array.
colourspacecan be of any type or form supported by thecolour.plotting.filter_RGB_colourspaces()definition.chromaticity_diagram_callable (callable, optional) – Callable responsible for drawing the Chromaticity Diagram.
method (unicode, optional) – {‘CIE 1931’, ‘CIE 1960 UCS’, ‘CIE 1976 UCS’}, Chromaticity Diagram method.
scatter_kwargs (dict, optional) –
Keyword arguments for the
plt.scatter()definition. The following special keyword arguments can also be used:c : unicode or array_like, if
cis set to RGB, the scatter will use the colours as given by theRGBargument.
**kwargs (dict, optional) – {
colour.plotting.artist(),colour.plotting.diagrams.plot_chromaticity_diagram(),colour.plotting.diagrams.plot_RGB_colourspaces_in_chromaticity_diagram(),colour.plotting.render()}, Please refer to the documentation of the previously listed definitions. Also handles keywords arguments for deprecation management.
- Returns
Current figure and axes.
- Return type
Examples
>>> RGB = np.random.random((128, 128, 3))
>>> plot_RGB_chromaticities_in_chromaticity_diagram(
...     RGB, 'ITU-R BT.709')
...
(<Figure size ... with 1 Axes>, <...AxesSubplot...>)