colour.plotting.models.plot_RGB_colourspaces_in_chromaticity_diagram
- colour.plotting.models.plot_RGB_colourspaces_in_chromaticity_diagram(colourspaces, cmfs='CIE 1931 2 Degree Standard Observer', chromaticity_diagram_callable=<function plot_chromaticity_diagram>, method='CIE 1931', show_whitepoints=True, show_pointer_gamut=False, chromatically_adapt=False, plot_kwargs=None, **kwargs)[source]
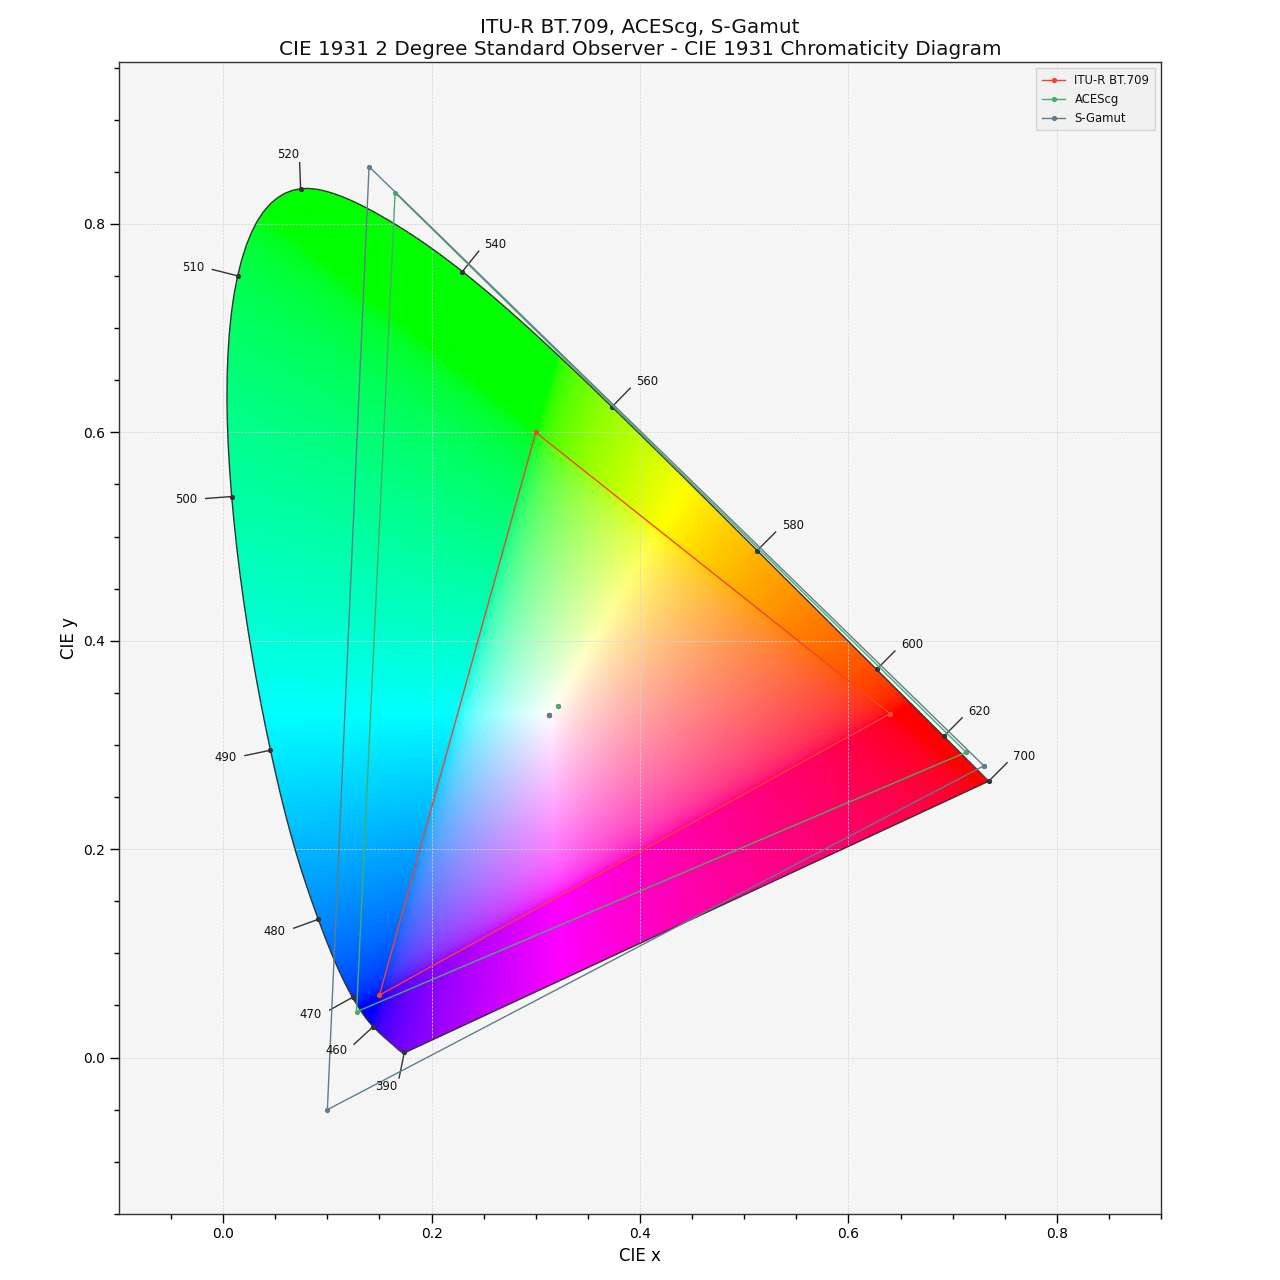
Plots given RGB colourspaces in the Chromaticity Diagram according to given method.
- Parameters
colourspaces (unicode or RGB_Colourspace or array_like) – RGB colourspaces to plot.
colourspaceselements can be of any type or form supported by thecolour.plotting.filter_RGB_colourspaces()definition.cmfs (unicode or XYZ_ColourMatchingFunctions, optional) – Standard observer colour matching functions used for computing the spectral locus boundaries.
cmfscan be of any type or form supported by thecolour.plotting.filter_cmfs()definition.chromaticity_diagram_callable (callable, optional) – Callable responsible for drawing the Chromaticity Diagram.
method (unicode, optional) – {‘CIE 1931’, ‘CIE 1960 UCS’, ‘CIE 1976 UCS’}, Chromaticity Diagram method.
show_whitepoints (bool, optional) – Whether to display the RGB colourspaces whitepoints.
show_pointer_gamut (bool, optional) – Whether to display the Pointer’s Gamut.
chromatically_adapt (bool, optional) – Whether to chromatically adapt the RGB colourspaces given in
colourspacesto the whitepoint of the default plotting colourspace.plot_kwargs (dict or array_like, optional) – Keyword arguments for the
plt.plot()definition, used to control the style of the plotted RGB colourspaces.plot_kwargscan be either a single dictionary applied to all the plotted RGB colourspaces with same settings or a sequence of dictionaries with different settings for each plotted RGB colourspace.**kwargs (dict, optional) – {
colour.plotting.artist(),colour.plotting.diagrams.plot_chromaticity_diagram(),colour.plotting.plot_pointer_gamut(),colour.plotting.render()}, Please refer to the documentation of the previously listed definitions.
- Returns
Current figure and axes.
- Return type
Examples
>>> plot_kwargs = [
...     {'color': 'r'},
...     {'linestyle': 'dashed'},
...     {'marker': None}
... ]
>>> plot_RGB_colourspaces_in_chromaticity_diagram(
...     ['ITU-R BT.709', 'ACEScg', 'S-Gamut'], plot_kwargs=plot_kwargs)
...
(<Figure size ... with 1 Axes>, <...AxesSubplot...>)