colour.plotting.plot_single_sd_colour_rendering_index_bars
- colour.plotting.plot_single_sd_colour_rendering_index_bars(sd, **kwargs)[source]
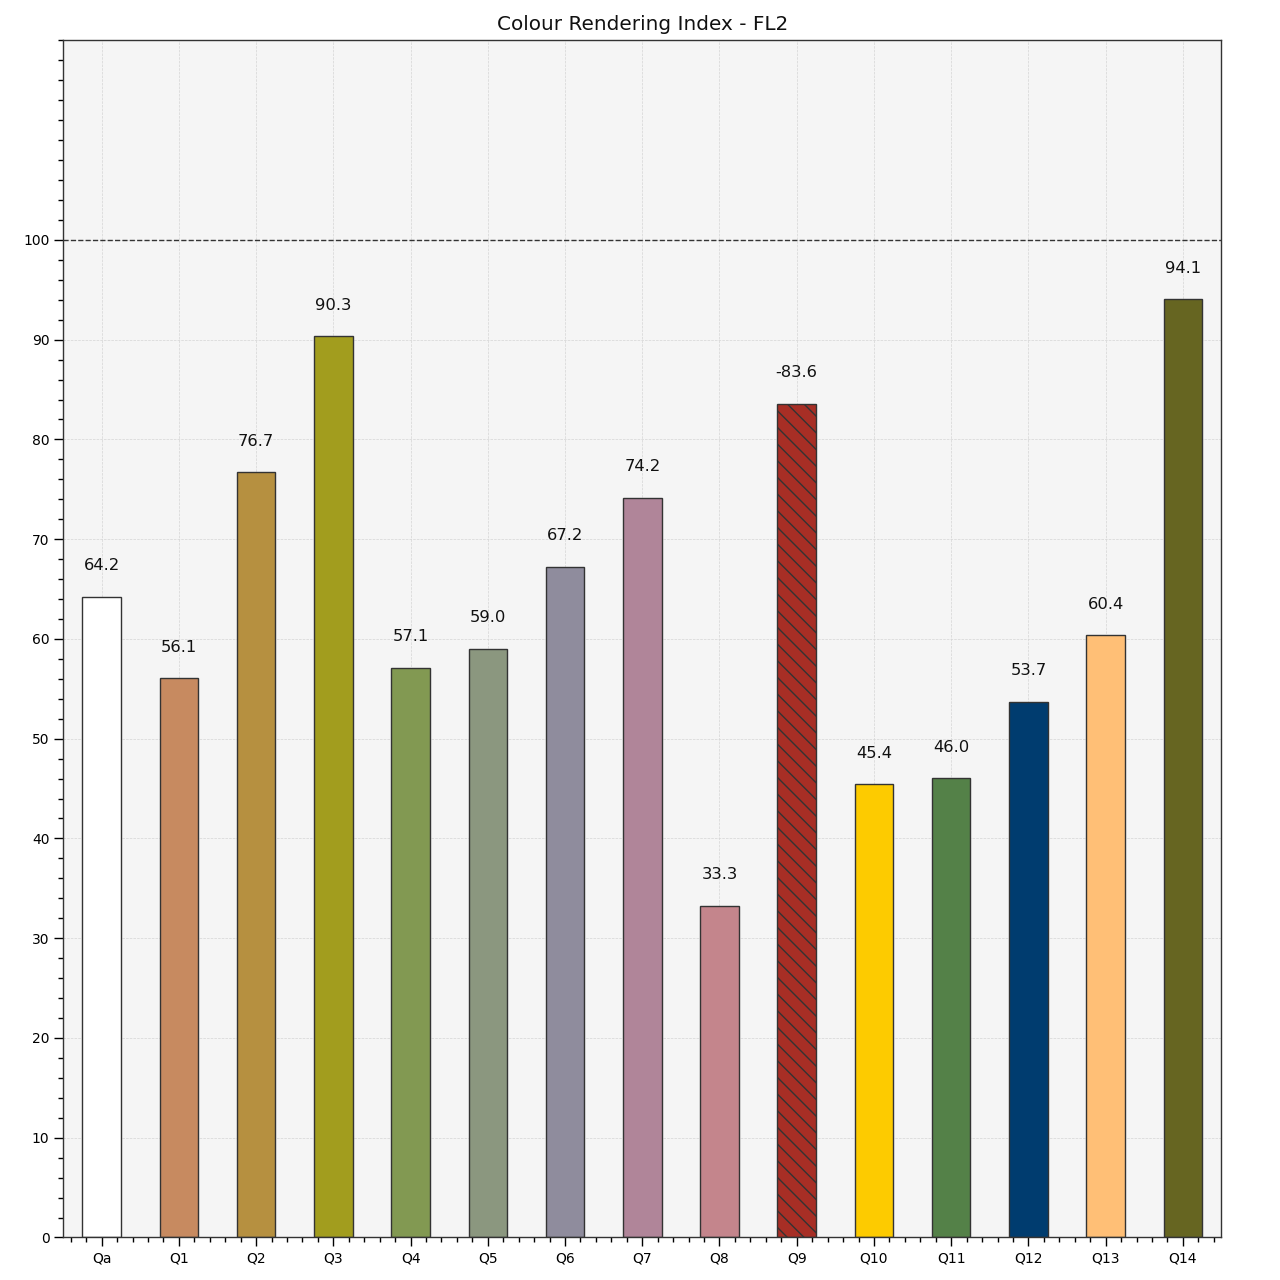
Plots the Colour Rendering Index (CRI) of given illuminant or light source spectral distribution.
- Parameters
sd (SpectralDistribution) – Illuminant or light source spectral distribution to plot the Colour Rendering Index (CRI).
**kwargs (dict, optional) – {
colour.plotting.artist(),colour.plotting.quality.plot_colour_quality_bars(),colour.plotting.render()}, Please refer to the documentation of the previously listed definitions.labels (bool, optional) – {
colour.plotting.quality.plot_colour_quality_bars()}, Add labels above bars.hatching (bool or None, optional) – {
colour.plotting.quality.plot_colour_quality_bars()}, Use hatching for the bars.hatching_repeat (int, optional) – {
colour.plotting.quality.plot_colour_quality_bars()}, Hatching pattern repeat.
- Returns
Current figure and axes.
- Return type
Examples
>>> from colour import SDS_ILLUMINANTS
>>> illuminant = SDS_ILLUMINANTS['FL2']
>>> plot_single_sd_colour_rendering_index_bars(illuminant)
...
(<Figure size ... with 1 Axes>, <...AxesSubplot...>)