colour.plotting.plot_RGB_colourspace_section
- colour.plotting.plot_RGB_colourspace_section(colourspace: Union[colour.models.rgb.rgb_colourspace.RGB_Colourspace, str, Sequence[Union[colour.models.rgb.rgb_colourspace.RGB_Colourspace, str]]], model: Union[Literal['CAM02LCD', 'CAM02SCD', 'CAM02UCS', 'CAM16LCD', 'CAM16SCD', 'CAM16UCS', 'CIE XYZ', 'CIE xyY', 'CIE Lab', 'CIE Luv', 'CIE UCS', 'CIE UVW', 'DIN99', 'Hunter Lab', 'Hunter Rdab', 'ICaCb', 'ICtCp', 'IPT', 'IgPgTg', 'Jzazbz', 'OSA UCS', 'Oklab', 'hdr-CIELAB', 'hdr-IPT'], str] = 'CIE xyY', axis: Union[Literal['+z', '+x', '+y'], str] = '+z', origin: float = 0.5, normalise: bool = True, show_section_colours: bool = True, show_section_contour: bool = True, **kwargs: Any) Tuple[matplotlib.figure.Figure, matplotlib.axes._axes.Axes][source]
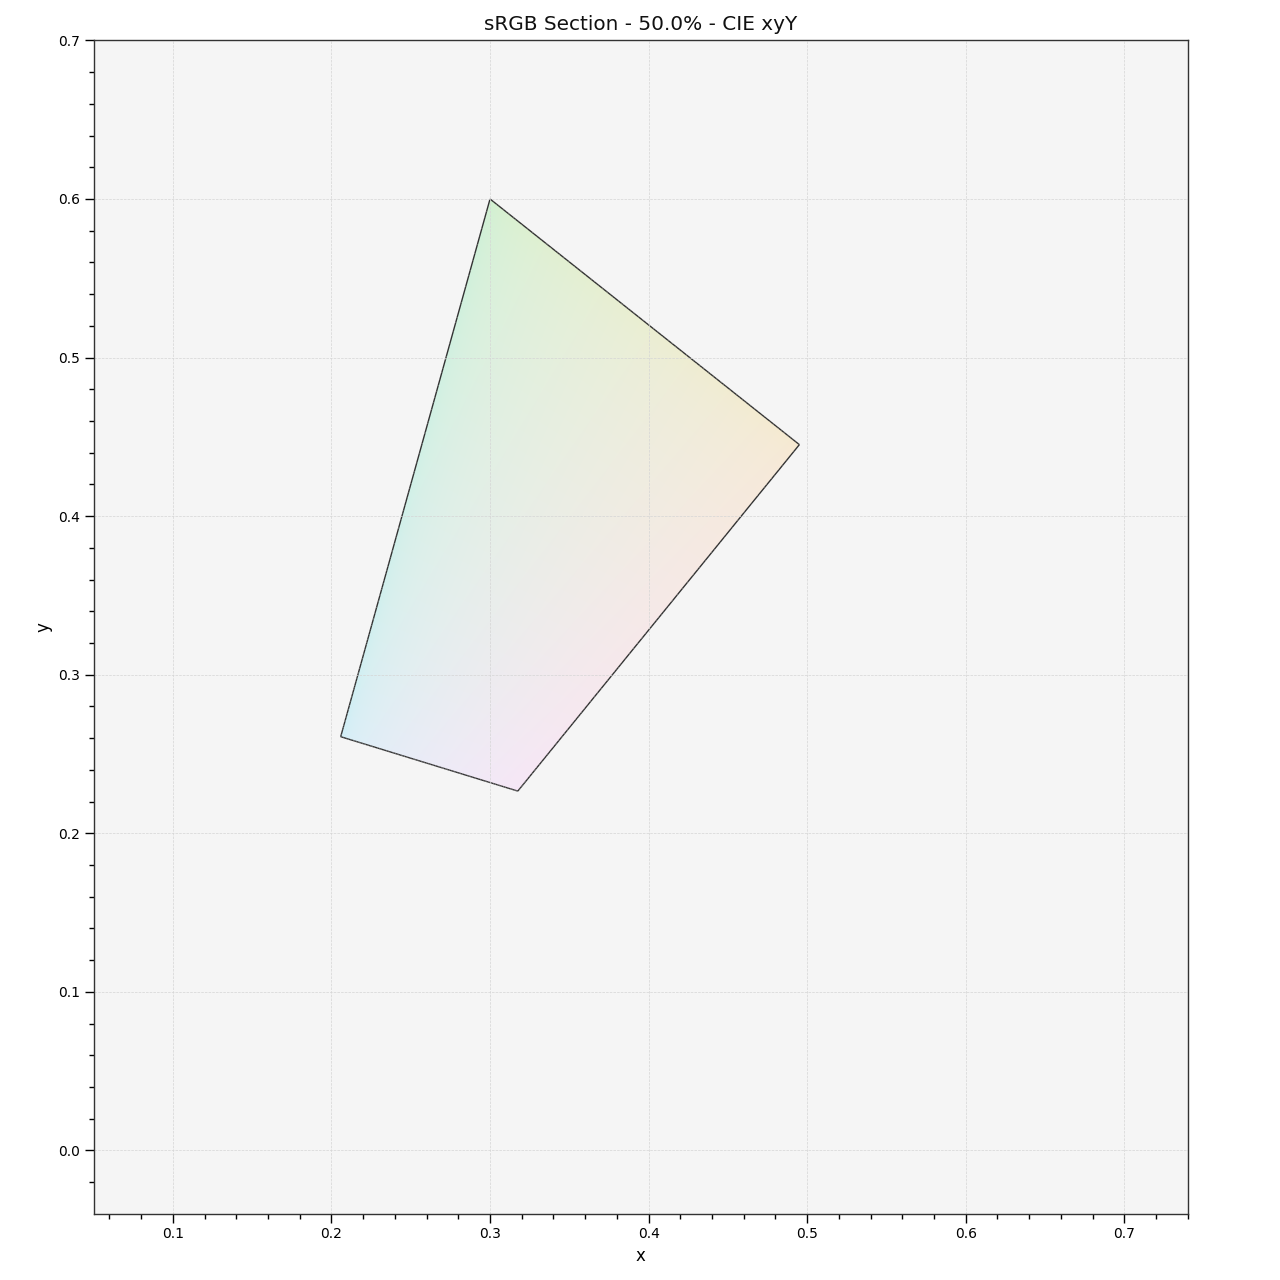
Plot given RGB colourspace section colours along given axis and origin.
- Parameters
colourspace (Union[colour.models.rgb.rgb_colourspace.RGB_Colourspace, str, Sequence[Union[colour.models.rgb.rgb_colourspace.RGB_Colourspace, str]]]) – RGB colourspace of the RGB array.
colourspacecan be of any type or form supported by thecolour.plotting.filter_RGB_colourspaces()definition.model (Union[Literal['CAM02LCD', 'CAM02SCD', 'CAM02UCS', 'CAM16LCD', 'CAM16SCD', 'CAM16UCS', 'CIE XYZ', 'CIE xyY', 'CIE Lab', 'CIE Luv', 'CIE UCS', 'CIE UVW', 'DIN99', 'Hunter Lab', 'Hunter Rdab', 'ICaCb', 'ICtCp', 'IPT', 'IgPgTg', 'Jzazbz', 'OSA UCS', 'Oklab', 'hdr-CIELAB', 'hdr-IPT'], str]) – Colourspace model, see
colour.COLOURSPACE_MODELSattribute for the list of supported colourspace models.axis (Union[Literal['+z', '+x', '+y'], str]) – Axis the hull section will be normal to.
origin (float) – Coordinate along
axisat which to plot the hull section.normalise (bool) – Whether to normalise
axisto the extent of the hull along it.show_section_colours (bool) – Whether to show the hull section colours.
show_section_contour (bool) – Whether to show the hull section contour.
kwargs (Any) – {
colour.plotting.artist(),colour.plotting.render(),colour.plotting.section.plot_hull_section_colours()colour.plotting.section.plot_hull_section_contour()}, See the documentation of the previously listed definitions.
- Returns
Current figure and axes.
- Return type
Examples
>>> from colour.utilities import is_trimesh_installed
>>> if is_trimesh_installed:
...     plot_RGB_colourspace_section(
...         'sRGB', section_colours='RGB', section_opacity=0.15)
...
(<Figure size ... with 1 Axes>, <...AxesSubplot...>)