colour.plotting.plot_single_luminance_function
- colour.plotting.plot_single_luminance_function(function: Union[Callable, str], **kwargs: Any) Tuple[matplotlib.figure.Figure, matplotlib.axes._axes.Axes][source]
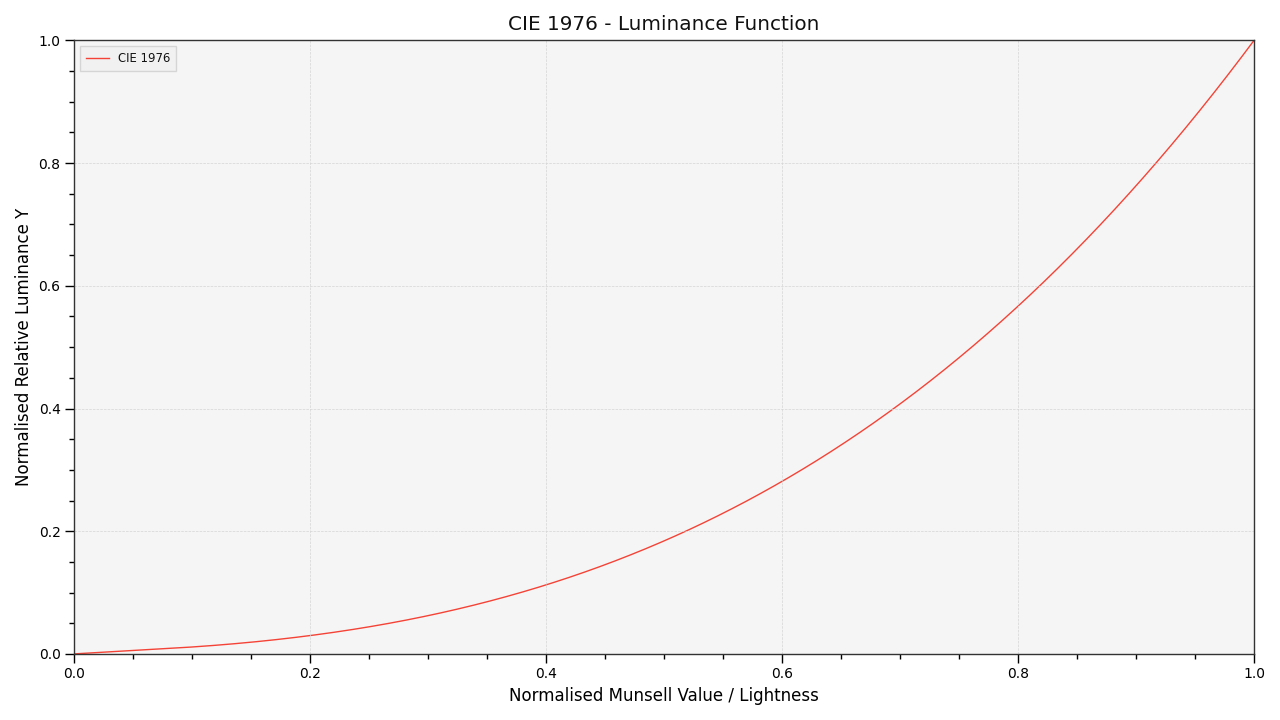
Plot given Luminance function.
- Parameters
function (Union[Callable, str]) – Luminance function to plot.
kwargs (Any) – {
colour.plotting.artist(),colour.plotting.plot_multi_functions(),colour.plotting.render()}, See the documentation of the previously listed definitions.
- Returns
Current figure and axes.
- Return type
Examples
>>> plot_single_luminance_function('CIE 1976')
(<Figure size ... with 1 Axes>, <...AxesSubplot...>)