colour.plotting.models.plot_RGB_chromaticities_in_chromaticity_diagram#
- colour.plotting.models.plot_RGB_chromaticities_in_chromaticity_diagram(RGB: ArrayLike, colourspace: RGB_Colourspace | str | Sequence[RGB_Colourspace | str] = 'sRGB', chromaticity_diagram_callable: Callable = plot_RGB_colourspaces_in_chromaticity_diagram, method: Literal['CIE 1931', 'CIE 1960 UCS', 'CIE 1976 UCS'] | str = 'CIE 1931', scatter_kwargs: Dict | None = None, **kwargs: Any) Tuple[Figure, Axes][source]#
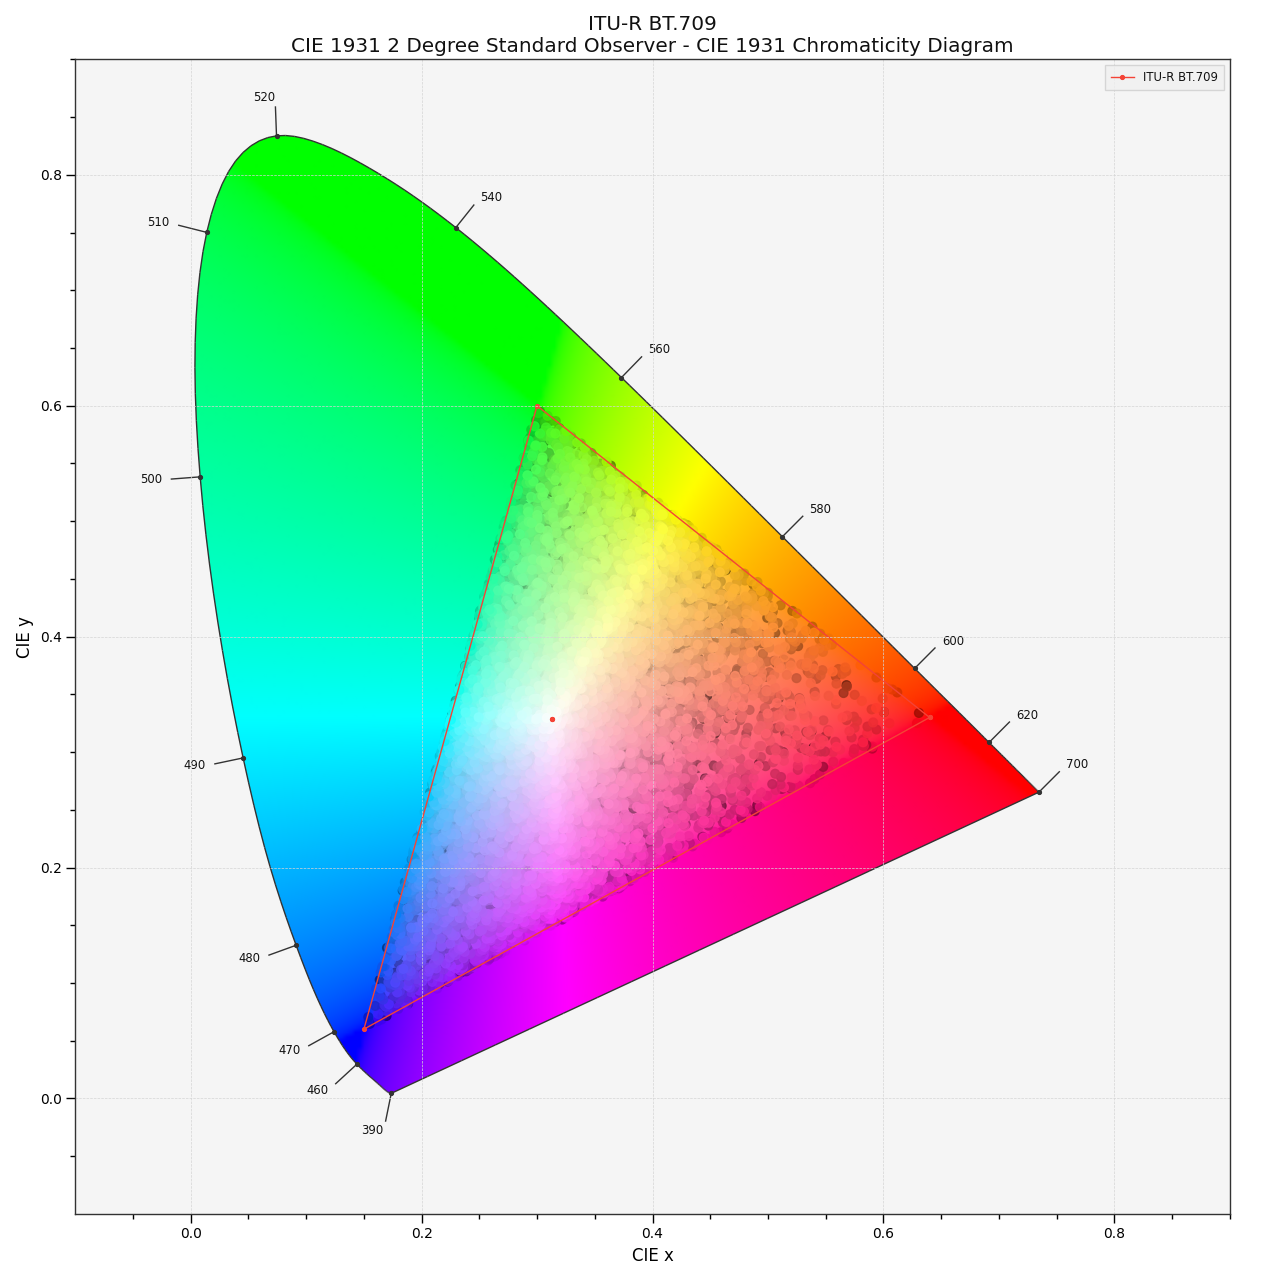
Plot given RGB colourspace array in the Chromaticity Diagram according to given method.
- Parameters:
RGB (ArrayLike) – RGB colourspace array.
colourspace (RGB_Colourspace | str | Sequence[RGB_Colourspace | str]) – RGB colourspace of the RGB array.
colourspacecan be of any type or form supported by thecolour.plotting.common.filter_RGB_colourspaces()definition.chromaticity_diagram_callable (Callable) – Callable responsible for drawing the Chromaticity Diagram.
method (Literal['CIE 1931', 'CIE 1960 UCS', 'CIE 1976 UCS'] | str) – Chromaticity Diagram method.
scatter_kwargs (Dict | None) –
Keyword arguments for the
matplotlib.pyplot.scatter()definition. The following special keyword arguments can also be used:c: Ifcis set to RGB, the scatter will use the colours as given by theRGBargument.
kwargs (Any) – {
colour.plotting.artist(),colour.plotting.diagrams.plot_chromaticity_diagram(),colour.plotting.models.plot_RGB_colourspaces_in_chromaticity_diagram(),colour.plotting.render()}, See the documentation of the previously listed definitions.
- Returns:
Current figure and axes.
- Return type:
Examples
>>> RGB = np.random.random((128, 128, 3))
>>> plot_RGB_chromaticities_in_chromaticity_diagram(RGB, "ITU-R BT.709")
...
(<Figure size ... with 1 Axes>, <...AxesSubplot...>)