colour.plotting.plot_single_function#
- colour.plotting.plot_single_function(function: Callable, samples: ArrayLike | None = None, log_x: int | None = None, log_y: int | None = None, plot_kwargs: Dict | List[Dict] | None = None, **kwargs: Any) Tuple[Figure, Axes][source]#
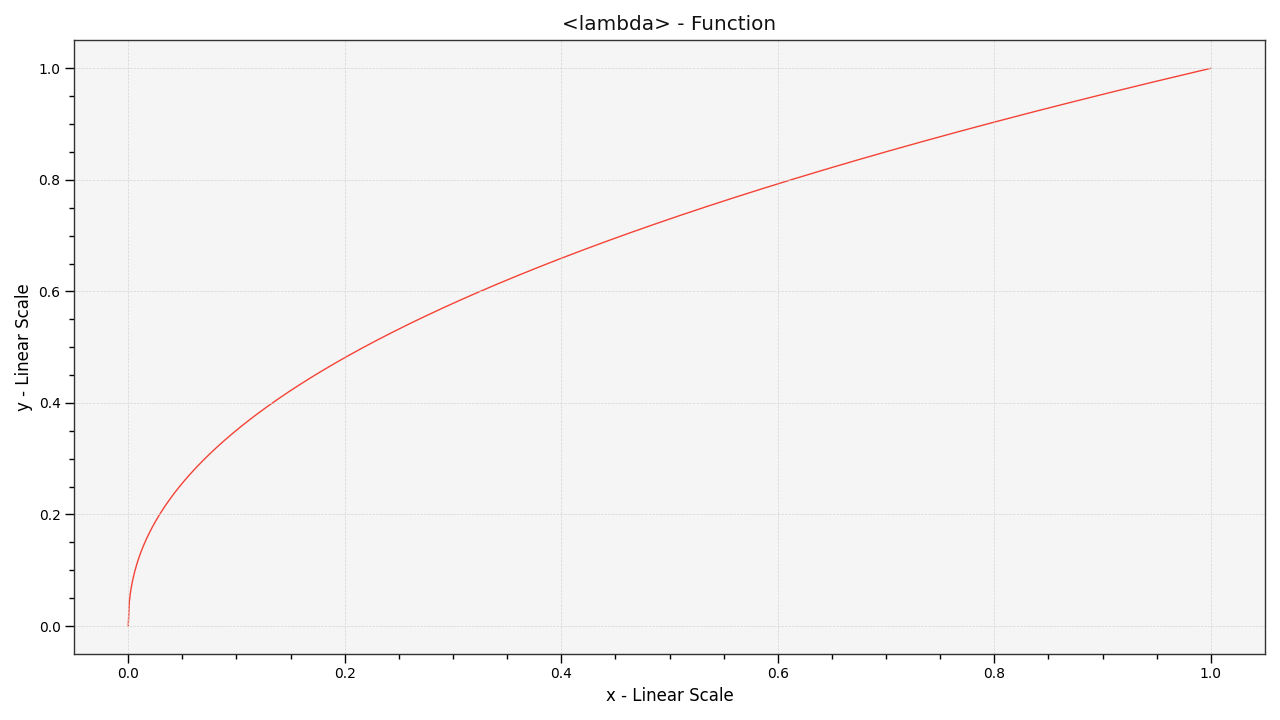
Plot given function.
- Parameters:
function (Callable) – Function to plot.
samples (ArrayLike | None) – Samples to evaluate the functions with.
log_x (int | None) – Log base to use for the x axis scale, if None, the x axis scale will be linear.
log_y (int | None) – Log base to use for the y axis scale, if None, the y axis scale will be linear.
plot_kwargs (Dict | List[Dict] | None) – Keyword arguments for the
matplotlib.pyplot.plot()definition, used to control the style of the plotted function.kwargs (Any) – {
colour.plotting.artist(),colour.plotting.plot_multi_functions(),colour.plotting.render()}, See the documentation of the previously listed definitions.
- Returns:
Current figure and axes.
- Return type:
Examples
>>> from colour.models import gamma_function
>>> plot_single_function(partial(gamma_function, exponent=1 / 2.2))
...
(<Figure size ... with 1 Axes>, <...AxesSubplot...>)