colour.plotting.plot_RGB_scatter
- colour.plotting.plot_RGB_scatter(RGB, colourspace, reference_colourspace='CIE xyY', colourspaces=None, segments=8, show_grid=True, grid_segments=10, show_spectral_locus=False, spectral_locus_colour=None, points_size=12, cmfs='CIE 1931 2 Degree Standard Observer', chromatically_adapt=False, **kwargs)[source]
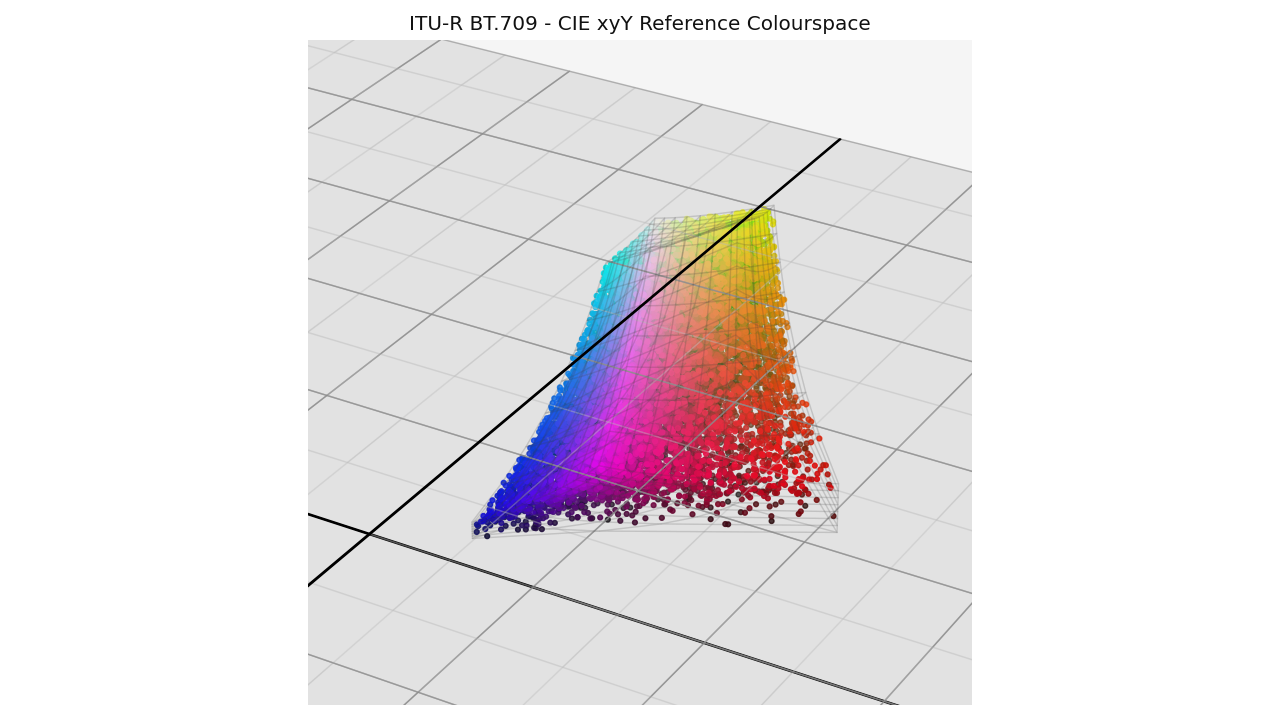
Plots given RGB colourspace array in a scatter plot.
- Parameters
RGB (array_like) – RGB colourspace array.
colourspace (unicode or RGB_Colourspace) – RGB colourspace of the RGB array.
colourspacecan be of any type or form supported by thecolour.plotting.filter_RGB_colourspaces()definition.reference_colourspace (unicode, optional) – {‘CIE XYZ’, ‘CIE xyY’, ‘CIE xy’, ‘CIE Lab’, ‘CIE LCHab’, ‘CIE Luv’, ‘CIE Luv uv’, ‘CIE LCHuv’, ‘CIE UCS’, ‘CIE UCS uv’, ‘CIE UVW’, ‘DIN 99’, ‘Hunter Lab’, ‘Hunter Rdab’, ‘IPT’, ‘JzAzBz’, ‘OSA UCS’, ‘hdr-CIELAB’, ‘hdr-IPT’}, Reference colourspace for colour conversion.
colourspaces (unicode or RGB_Colourspace or array_like) – RGB colourspaces to plot the gamuts.
colourspaceselements can be of any type or form supported by thecolour.plotting.filter_RGB_colourspaces()definition.segments (int, optional) – Edge segments count for each RGB colourspace cubes.
show_grid (bool, optional) – Whether to show a grid at the bottom of the RGB colourspace cubes.
grid_segments (bool, optional) – Edge segments count for the grid.
show_spectral_locus (bool, optional) – Whether to show the spectral locus.
spectral_locus_colour (array_like, optional) – Spectral locus colour.
points_size (numeric, optional) – Scatter points size.
cmfs (unicode or XYZ_ColourMatchingFunctions, optional) – Standard observer colour matching functions used for computing the spectral locus boundaries.
cmfscan be of any type or form supported by thecolour.plotting.filter_cmfs()definition.chromatically_adapt (bool, optional) – Whether to chromatically adapt the RGB colourspaces given in
colourspacesto the whitepoint of the default plotting colourspace.**kwargs (dict, optional) – {
colour.plotting.artist(),colour.plotting.plot_RGB_colourspaces_gamuts()}, Please refer to the documentation of the previously listed definitions.
- Returns
Current figure and axes.
- Return type
Examples
>>> RGB = np.random.random((128, 128, 3))
>>> plot_RGB_scatter(RGB, 'ITU-R BT.709')
(<Figure size ... with 1 Axes>, <...Axes3DSubplot...>)