colour.plotting.temperature.plot_planckian_locus_in_chromaticity_diagram
- colour.plotting.temperature.plot_planckian_locus_in_chromaticity_diagram(illuminants, chromaticity_diagram_callable=<function plot_chromaticity_diagram>, planckian_locus_callable=<function plot_planckian_locus>, method='CIE 1931', annotate_kwargs=None, plot_kwargs=None, **kwargs)[source]
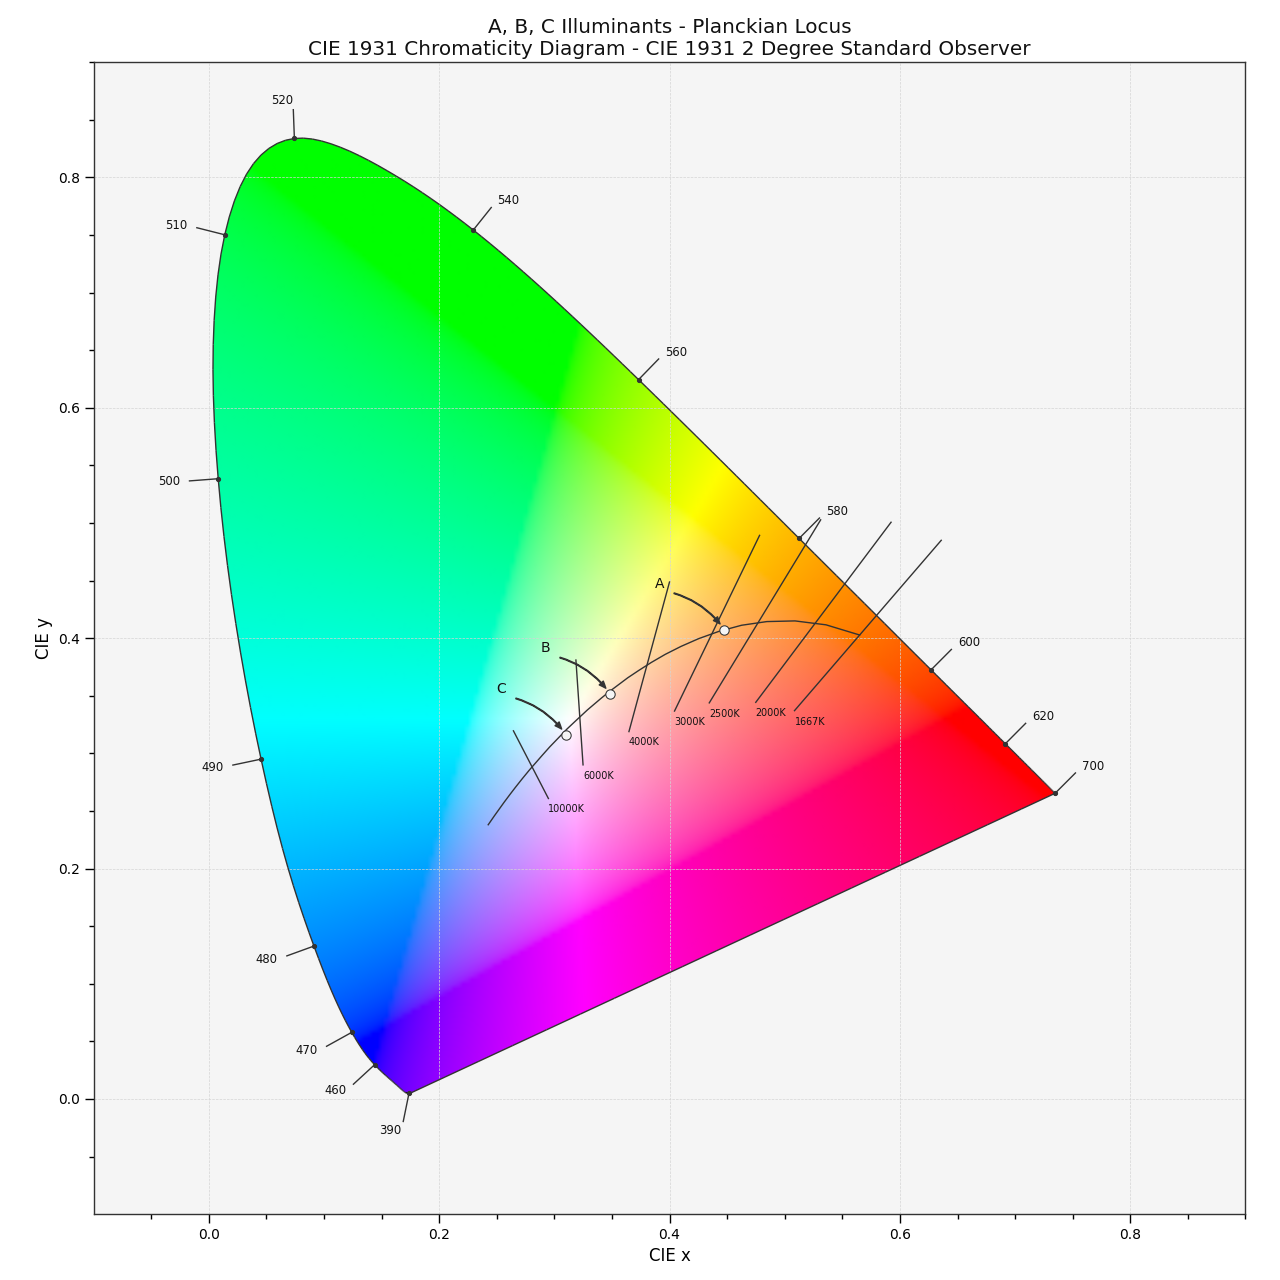
Plots the Planckian Locus and given illuminants in the Chromaticity Diagram according to given method.
- Parameters
illuminants (unicode or object or array_like) – Illuminants to plot.
illuminantselements can be of any type or form supported by thecolour.plotting.filter_passthrough()definition.chromaticity_diagram_callable (callable, optional) – Callable responsible for drawing the Chromaticity Diagram.
planckian_locus_callable (callable, optional) – Callable responsible for drawing the Planckian Locus.
method (unicode, optional) – {‘CIE 1931’, ‘CIE 1960 UCS’, ‘CIE 1976 UCS’}, Chromaticity Diagram method.
annotate_kwargs (dict or array_like, optional) –
Keyword arguments for the
plt.annotate()definition, used to annotate the resulting chromaticity coordinates with their respective illuminant names.annotate_kwargscan be either a single dictionary applied to all the arrows with same settings or a sequence of dictionaries with different settings for each illuminant. The following special keyword arguments can also be used:annotate : bool, whether to annotate the illuminants.
plot_kwargs (dict or array_like, optional) – Keyword arguments for the
plt.plot()definition, used to control the style of the plotted illuminants.plot_kwargscan be either a single dictionary applied to all the plotted illuminants with same settings or a sequence of dictionaries with different settings for each plotted illuminant.**kwargs (dict, optional) – {
colour.plotting.artist(),colour.plotting.diagrams.plot_chromaticity_diagram(),colour.plotting.temperature.plot_planckian_locus(),colour.plotting.render()}, Please refer to the documentation of the previously listed definitions. Also handles keywords arguments for deprecation management.
- Returns
Current figure and axes.
- Return type
Examples
>>> annotate_kwargs = [
...     {'xytext': (-25, 15), 'arrowprops':{'arrowstyle':'-'}},
...     {'arrowprops':{'arrowstyle':'-['}},
...     {},
... ]
>>> plot_kwargs = [
...     {
...         'markersize' : 15,
...     },
...     {   'color': 'r'},
...     {},
... ]
>>> plot_planckian_locus_in_chromaticity_diagram(
...     ['A', 'B', 'C'],
...     annotate_kwargs=annotate_kwargs,
...     plot_kwargs=plot_kwargs
... )
(<Figure size ... with 1 Axes>, <...AxesSubplot...>)