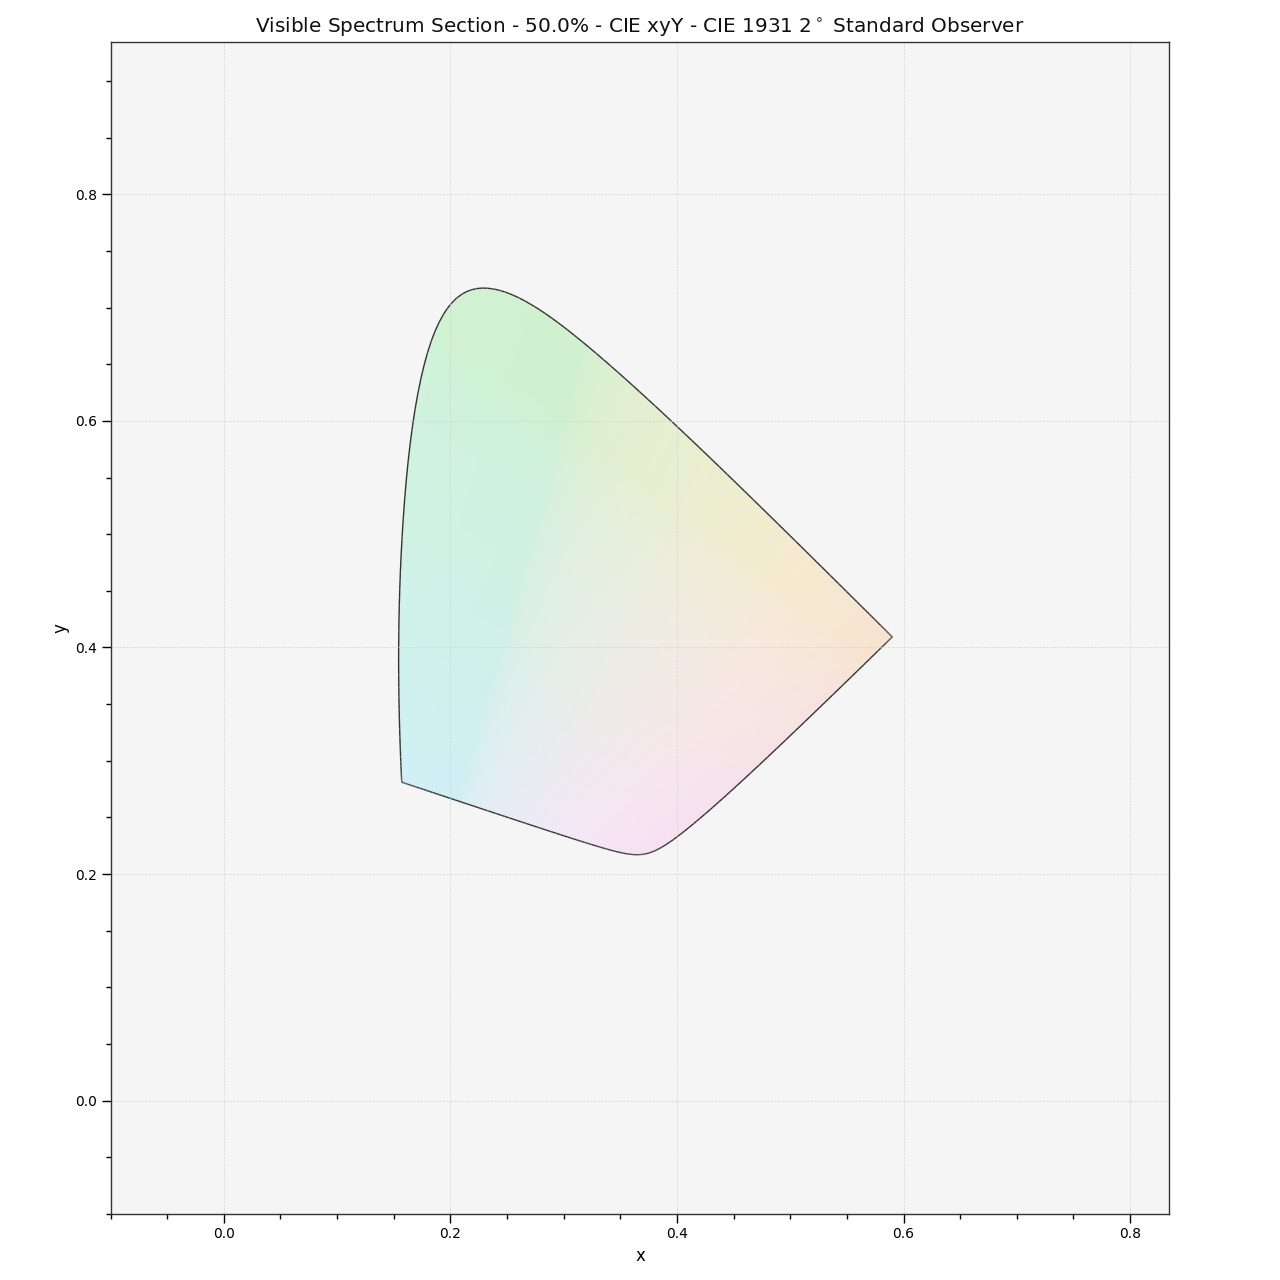
colour.plotting.plot_visible_spectrum_section#
- colour.plotting.plot_visible_spectrum_section(cmfs: MultiSpectralDistributions | str | Sequence[MultiSpectralDistributions | str] = 'CIE 1931 2 Degree Standard Observer', illuminant: SpectralDistribution | str = 'D65', model: Literal['CAM02LCD', 'CAM02SCD', 'CAM02UCS', 'CAM16LCD', 'CAM16SCD', 'CAM16UCS', 'CIE Lab', 'CIE Luv', 'CIE UCS', 'CIE UVW', 'CIE XYZ', 'CIE xyY', 'DIN99', 'HCL', 'HSL', 'HSV', 'Hunter Lab', 'Hunter Rdab', 'ICaCb', 'ICtCp', 'IHLS', 'IPT', 'IPT Ragoo 2021', 'IgPgTg', 'Jzazbz', 'OSA UCS', 'Oklab', 'RGB', 'YCbCr', 'YCoCg', 'Yrg', 'hdr-CIELAB', 'hdr-IPT'] | str = 'CIE xyY', axis: Literal['+z', '+x', '+y'] | str = '+z', origin: float = 0.5, normalise: bool = True, show_section_colours: bool = True, show_section_contour: bool = True, **kwargs: Any) Tuple[Figure, Axes][source]#
Plot the visible spectrum volume, i.e. Rösch-MacAdam colour solid, section colours along given axis and origin.
- Parameters:
cmfs (MultiSpectralDistributions | str | Sequence[MultiSpectralDistributions | str]) – Standard observer colour matching functions, default to the CIE 1931 2 Degree Standard Observer.
cmfscan be of any type or form supported by thecolour.plotting.common.filter_cmfs()definition.illuminant (SpectralDistribution | str) – Illuminant spectral distribution, default to CIE Illuminant D65.
illuminantcan be of any type or form supported by thecolour.plotting.common.filter_illuminants()definition.model (Literal['CAM02LCD', 'CAM02SCD', 'CAM02UCS', 'CAM16LCD', 'CAM16SCD', 'CAM16UCS', 'CIE Lab', 'CIE Luv', 'CIE UCS', 'CIE UVW', 'CIE XYZ', 'CIE xyY', 'DIN99', 'HCL', 'HSL', 'HSV', 'Hunter Lab', 'Hunter Rdab', 'ICaCb', 'ICtCp', 'IHLS', 'IPT', 'IPT Ragoo 2021', 'IgPgTg', 'Jzazbz', 'OSA UCS', 'Oklab', 'RGB', 'YCbCr', 'YCoCg', 'Yrg', 'hdr-CIELAB', 'hdr-IPT'] | str) – Colourspace model, see
colour.COLOURSPACE_MODELSattribute for the list of supported colourspace models.axis (Literal['+z', '+x', '+y'] | str) – Axis the hull section will be normal to.
origin (float) – Coordinate along
axisat which to plot the hull section.normalise (bool) – Whether to normalise
axisto the extent of the hull along it.show_section_colours (bool) – Whether to show the hull section colours.
show_section_contour (bool) – Whether to show the hull section contour.
kwargs (Any) – {
colour.plotting.artist(),colour.plotting.render(),colour.plotting.section.plot_hull_section_colours()colour.plotting.section.plot_hull_section_contour()}, See the documentation of the previously listed definitions.
- Returns:
Current figure and axes.
- Return type:
Examples
>>> from colour.utilities import is_trimesh_installed
>>> if is_trimesh_installed:
...     plot_visible_spectrum_section(
...         section_colours="RGB", section_opacity=0.15
...     )
...
...
(<Figure size ... with 1 Axes>, <...Axes...>)
