colour.plotting.tm3018.plot_single_sd_colour_rendition_report_full#
- colour.plotting.tm3018.plot_single_sd_colour_rendition_report_full(sd: SpectralDistribution, source: str | None = None, date: str | None = None, manufacturer: str | None = None, model: str | None = None, notes: str | None = None, report_size: tuple[float, float] = CONSTANT_REPORT_SIZE_FULL, report_row_height_ratios: tuple = CONSTANT_REPORT_ROW_HEIGHT_RATIOS_FULL, report_box_padding: dict | None = None, **kwargs: Any) Tuple[Figure, Axes][source]#
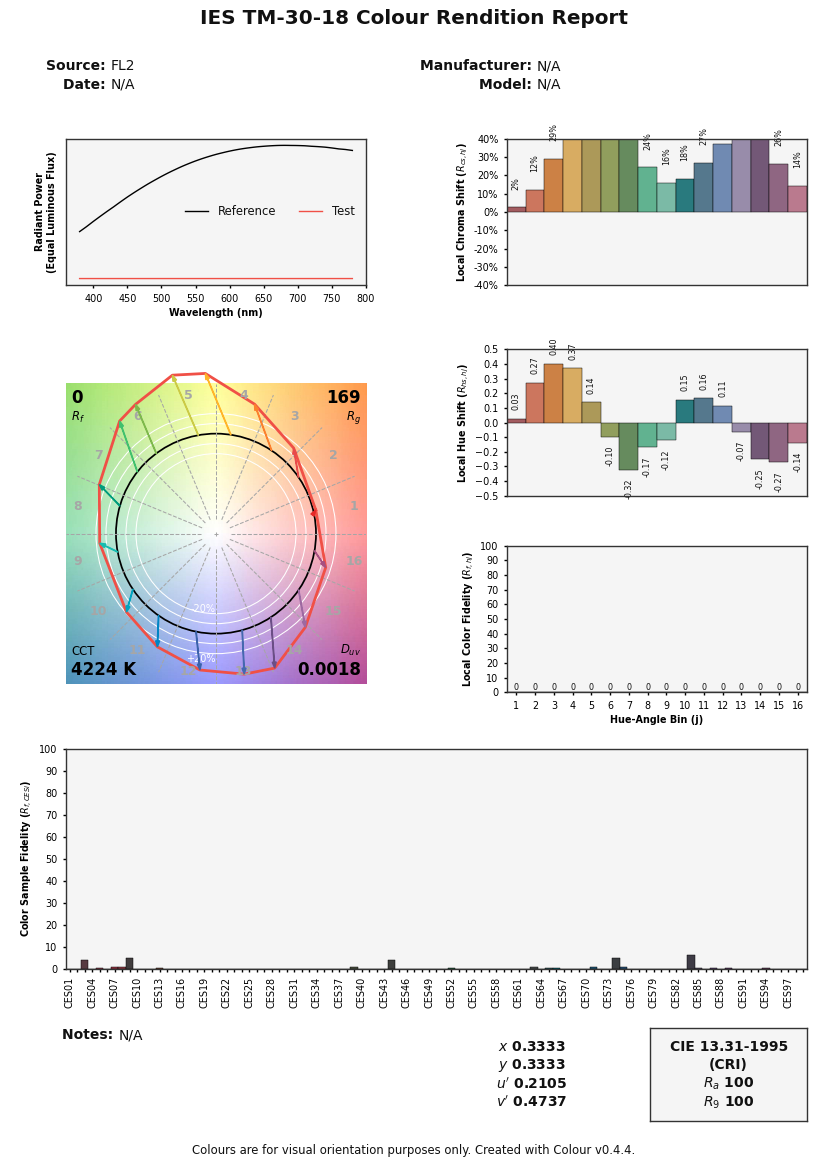
Generate the full ANSI/IES TM-30-18 Colour Rendition Report for the specified spectral distribution.
- Parameters:
sd (SpectralDistribution) – Spectral distribution of the emission source to generate the report for.
source (str | None) – Emission source name, defaults to the colour.SpectralDistribution_IESTM2714.header.description or colour.SpectralDistribution_IESTM2714.name property value.
date (str | None) – Emission source measurement date, defaults to the colour.SpectralDistribution_IESTM2714.header.report_date property value.
manufacturer (str | None) – Emission source manufacturer, defaults to the colour.SpectralDistribution_IESTM2714.header.manufacturer property value.
model (str | None) – Emission source model, defaults to the colour.SpectralDistribution_IESTM2714.header.catalog_number property value.
notes (str | None) – Notes pertaining to the emission source, defaults to the colour.SpectralDistribution_IESTM2714.header.comments property value.
report_size (tuple[float, float]) – Report size, defaults to A4 paper size in inches.
report_row_height_ratios (tuple) – Report size row height ratios.
report_box_padding (dict | None) – Report box padding, defines the padding around the figure and between the axes.
kwargs (Any) – {
colour.plotting.artist(),colour.plotting.render()}, See the documentation of the previously listed definitions.
- Returns:
Current figure and axes.
- Return type:
Examples
>>> from colour import SDS_ILLUMINANTS
>>> sd = SDS_ILLUMINANTS["FL2"]
>>> plot_single_sd_colour_rendition_report_full(sd)
...
(<Figure size ... with ... Axes>, <...Axes...>)