colour.plotting.plot_multi_illuminant_sds#
- colour.plotting.plot_multi_illuminant_sds(illuminants: colour.colorimetry.spectrum.SpectralDistribution | str | collections.abc.Sequence[colour.colorimetry.spectrum.SpectralDistribution | str], **kwargs: Any) Tuple[matplotlib.figure.Figure, matplotlib.axes._axes.Axes][source]#
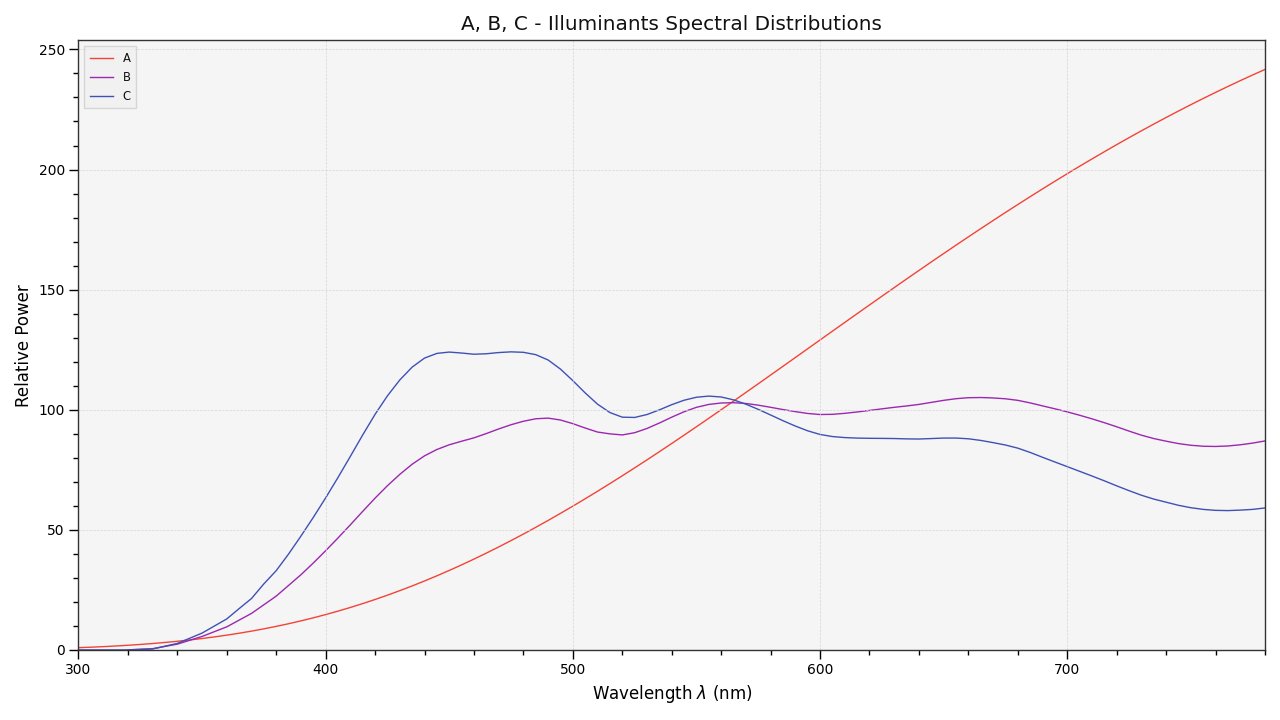
Plot given illuminants spectral distributions.
- Parameters
illuminants (colour.colorimetry.spectrum.SpectralDistribution | str | collections.abc.Sequence[colour.colorimetry.spectrum.SpectralDistribution | str]) – Illuminants to plot.
illuminantselements can be of any type or form supported by thecolour.plotting.common.filter_illuminants()definition.kwargs (Any) – {
colour.plotting.artist(),colour.plotting.plot_multi_sds(),colour.plotting.render()}, See the documentation of the previously listed definitions.
- Returns
Current figure and axes.
- Return type
Examples
>>> plot_multi_illuminant_sds(["A", "B", "C"])
(<Figure size ... with 1 Axes>, <...Axes...>)