colour.plotting.temperature.plot_planckian_locus_in_chromaticity_diagram#
- colour.plotting.temperature.plot_planckian_locus_in_chromaticity_diagram(illuminants: str | collections.abc.Sequence[str], chromaticity_diagram_callable: Callable = plot_chromaticity_diagram, method: Union[Literal['CIE 1931', 'CIE 1960 UCS', 'CIE 1976 UCS'], str] = 'CIE 1931', annotate_kwargs: Optional[Union[dict, List[dict]]] = None, plot_kwargs: Optional[Union[dict, List[dict]]] = None, **kwargs: Any) Tuple[matplotlib.figure.Figure, matplotlib.axes._axes.Axes][source]#
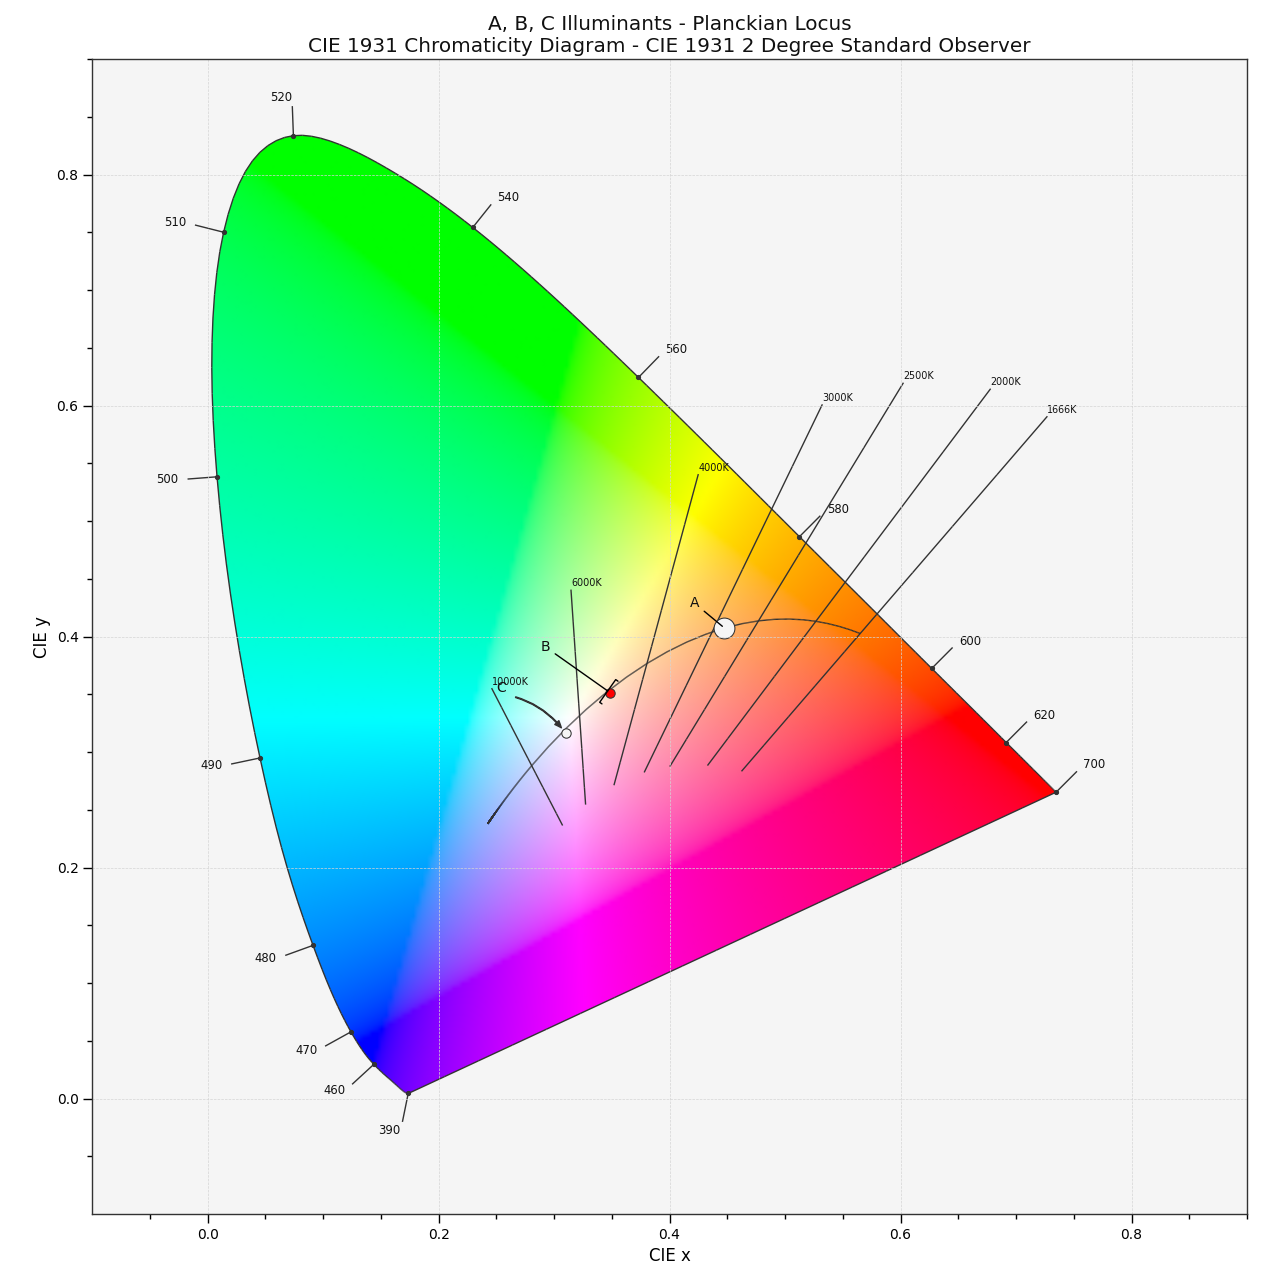
Plot the Planckian Locus and given illuminants in the Chromaticity Diagram according to given method.
- Parameters
illuminants (str | collections.abc.Sequence[str]) – Illuminants to plot.
illuminantselements can be of any type or form supported by thecolour.plotting.common.filter_passthrough()definition.chromaticity_diagram_callable (Callable) – Callable responsible for drawing the Chromaticity Diagram.
method (Union[Literal['CIE 1931', 'CIE 1960 UCS', 'CIE 1976 UCS'], str]) – Chromaticity Diagram method.
annotate_kwargs (Optional[Union[dict, List[dict]]]) –
Keyword arguments for the
matplotlib.pyplot.annotate()definition, used to annotate the resulting chromaticity coordinates with their respective spectral distribution names.annotate_kwargscan be either a single dictionary applied to all the arrows with same settings or a sequence of dictionaries with different settings for each spectral distribution. The following special keyword arguments can also be used:annotate: Whether to annotate the spectral distributions.
plot_kwargs (Optional[Union[dict, List[dict]]]) – Keyword arguments for the
matplotlib.pyplot.plot()definition, used to control the style of the plotted illuminants.plot_kwargscan be either a single dictionary applied to all the plotted illuminants with the same settings or a sequence of dictionaries with different settings for eachplotted illuminant.kwargs (Any) – {
colour.plotting.artist(),colour.plotting.diagrams.plot_chromaticity_diagram(),colour.plotting.temperature.plot_planckian_locus(),colour.plotting.render()}, See the documentation of the previously listed definitions.
- Returns
Current figure and axes.
- Return type
Examples
>>> annotate_kwargs = [
...     {"xytext": (-25, 15), "arrowprops": {"arrowstyle": "-"}},
...     {"arrowprops": {"arrowstyle": "-["}},
...     {},
... ]
>>> plot_kwargs = [
...     {
...         "markersize": 15,
...     },
...     {"color": "r"},
...     {},
... ]
>>> plot_planckian_locus_in_chromaticity_diagram(
...     ["A", "B", "C"],
...     annotate_kwargs=annotate_kwargs,
...     plot_kwargs=plot_kwargs,
... )
(<Figure size ... with 1 Axes>, <...Axes...>)