colour.plotting.plot_image#
- colour.plotting.plot_image(image: ArrayLike, imshow_kwargs: dict | None = None, text_kwargs: dict | None = None, **kwargs: Any) Tuple[Figure, Axes][source]#
Plot the specified image using matplotlib.
- Parameters:
image (ArrayLike) – Image array to plot, typically as RGB or grayscale data.
imshow_kwargs (dict | None) – Keyword arguments for the
matplotlib.pyplot.imshow()definition, controlling image display properties.text_kwargs (dict | None) –
Keyword arguments for the
matplotlib.pyplot.text()definition, controlling text overlay properties. The following special keyword arguments can also be used:offset: Sets the text offset position.
kwargs (Any) – {
colour.plotting.artist(),colour.plotting.render()}, See the documentation of the previously listed definitions for additional plotting controls.
- Returns:
Current figure and axes objects from matplotlib.
- Return type:
Examples
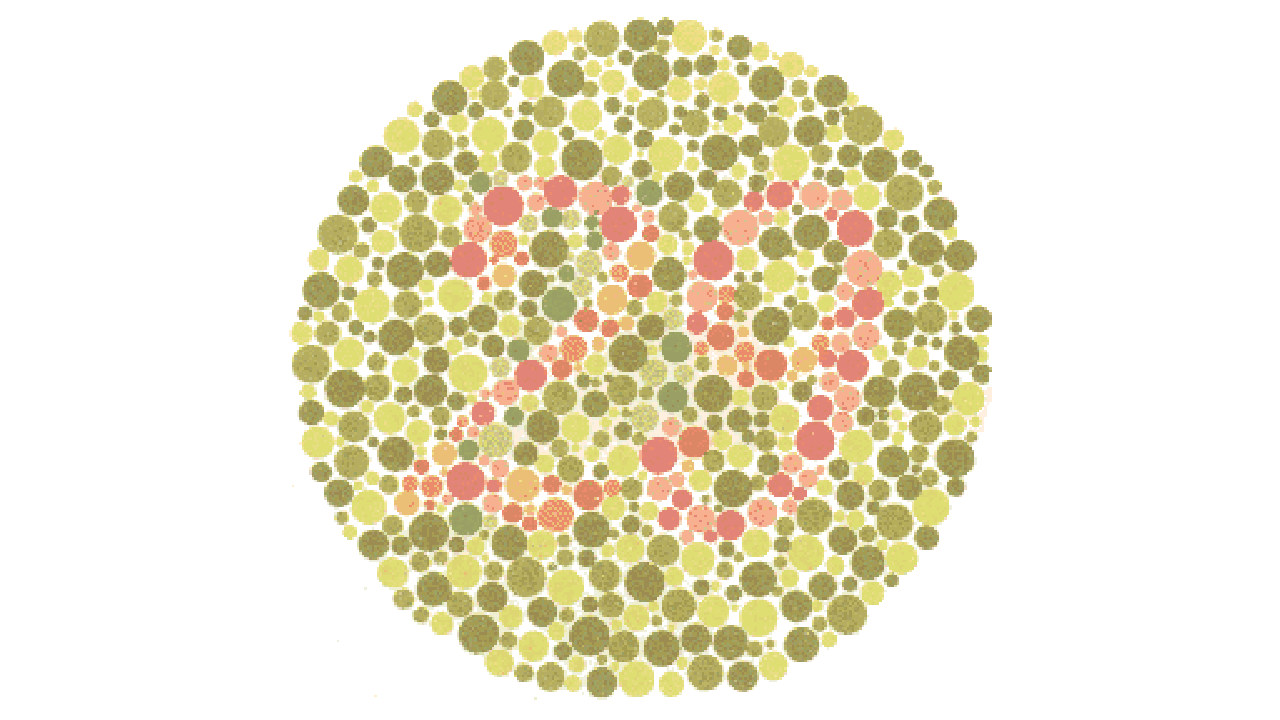
>>> import os
>>> import colour
>>> from colour import read_image
>>> path = os.path.join(
...     colour.__path__[0],
...     "examples",
...     "plotting",
...     "resources",
...     "Ishihara_Colour_Blindness_Test_Plate_3.png",
... )
>>> plot_image(read_image(path))
(<Figure size ... with 1 Axes>, <...Axes...>)