colour.plotting.plot_multi_layer_stack#
- colour.plotting.plot_multi_layer_stack(configurations: Sequence[Dict[str, Any]], theta: ArrayLike | None = None, wavelength: ArrayLike = 555, **kwargs: Any) Tuple[Figure, Axes][source]#
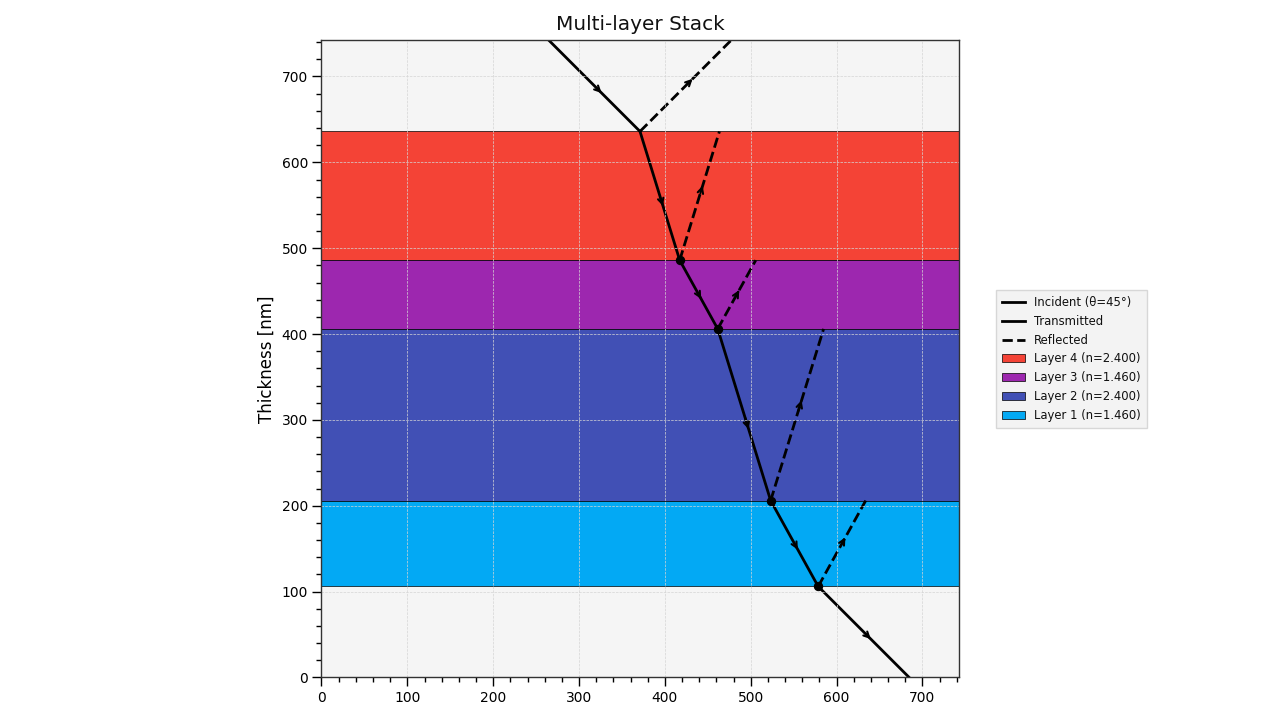
Plot a multilayer stack as a stacked horizontal bar chart with optional ray paths.
Creates a visualization showing the layer structure of a multilayer thin film or any other multilayer system. Each layer is represented as a horizontal bar with height proportional to its thickness, stacked vertically. If an incident angle is provided, the function also draws ray paths showing refraction through each layer using Snell’s law.
- Parameters:
configurations (Sequence[Dict[str, Any]]) –
Sequence of dictionaries, each containing layer configuration: {‘t’: float, ‘n’: float, ‘color’: str, ‘label’: str}
’t’: Layer thickness in nanometers or any other unit (required)
’n’: Refractive index (required)
’color’: Layer color (optional, automatically assigned from the default colour cycle if not provided)
’label’: Layer label (optional, defaults to “Layer N (n=value)”)
theta (ArrayLike | None) – Incident angle \(\theta\) in degrees. If provided, ray paths will be drawn showing refraction through each layer using Snell’s law. Default is None (no ray paths).
wavelength (ArrayLike) – Wavelength in nanometers used for transfer matrix calculations when theta is provided. Default is 555 nm.
kwargs (Any) – {
colour.plotting.artist(),colour.plotting.render()}, See the documentation of the previously listed definitions.
- Returns:
Current figure and axes.
- Return type:
Examples
>>> configurations = [
...     {"t": 100, "n": 1.46},
...     {"t": 200, "n": 2.4},
...     {"t": 80, "n": 1.46},
...     {"t": 150, "n": 2.4},
... ]
>>> plot_multi_layer_stack(configurations, theta=45)
(<Figure size ... with 1 Axes>, <...Axes...>)