colour.plotting.plot_single_sd_colour_rendering_index_bars#
- colour.plotting.plot_single_sd_colour_rendering_index_bars(sd: SpectralDistribution, **kwargs: Any) Tuple[Figure, Axes][source]#
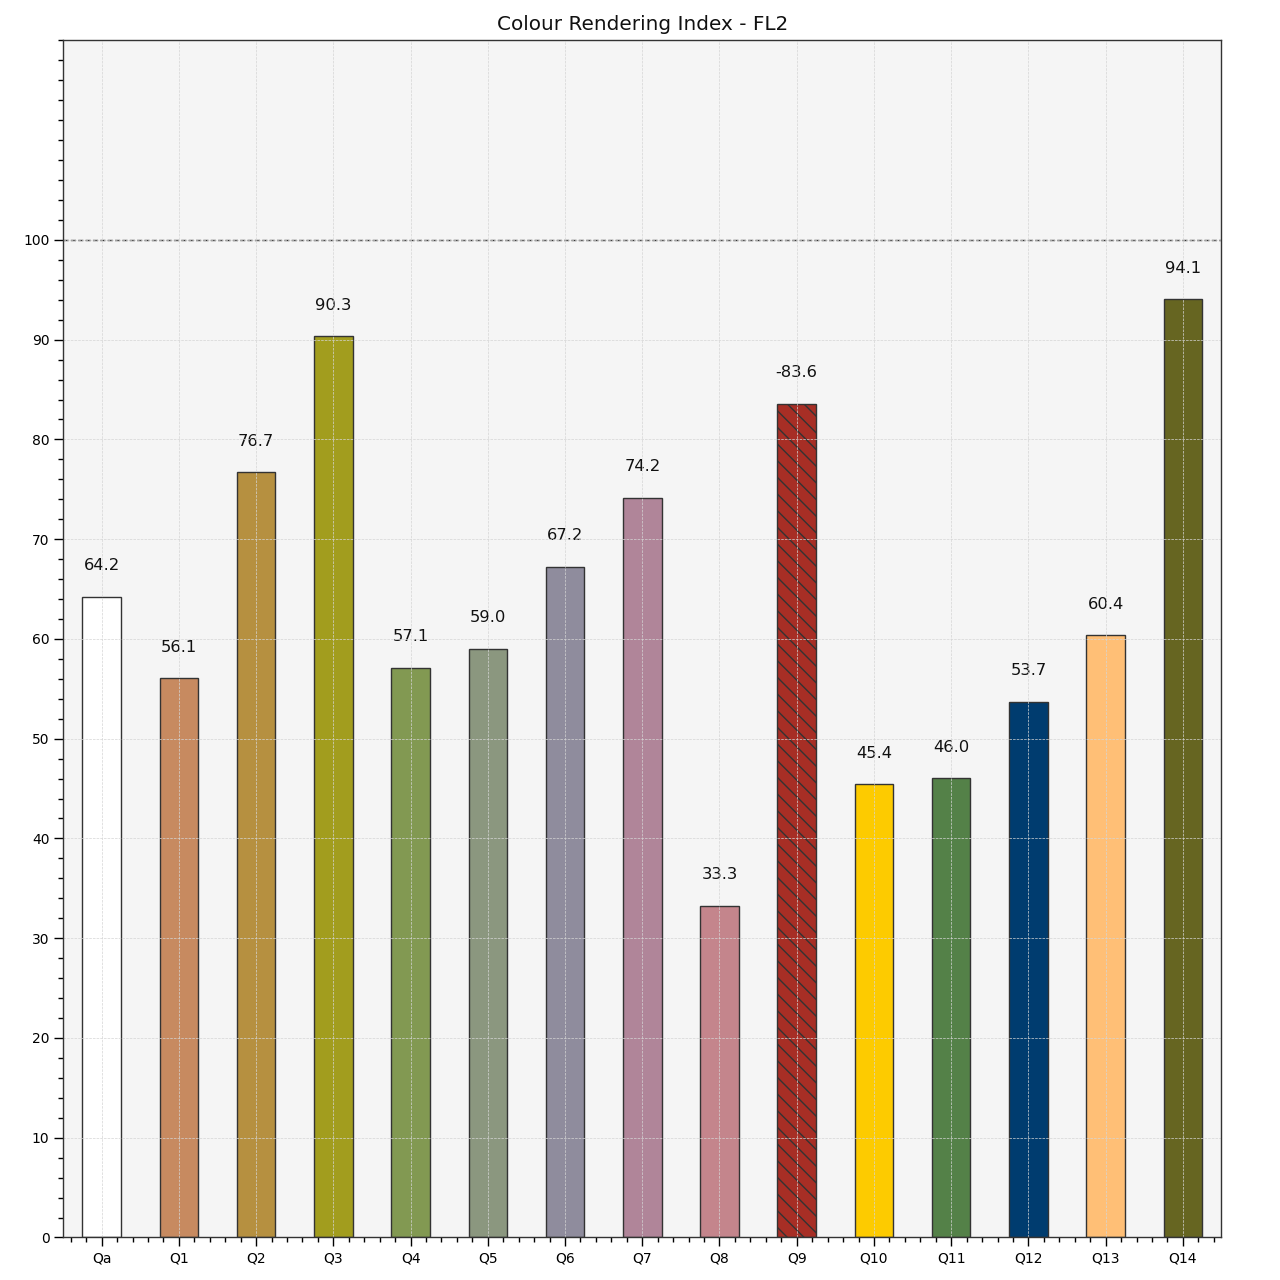
Plot the Colour Rendering Index (CRI) of the specified illuminant or light source spectral distribution.
- Parameters:
sd (SpectralDistribution) – Illuminant or light source spectral distribution for which to plot the Colour Rendering Index (CRI).
kwargs (Any) – {
colour.plotting.artist(),colour.plotting.quality.plot_colour_quality_bars(),colour.plotting.render()}, See the documentation of the previously listed definitions.
- Returns:
Current figure and axes.
- Return type:
Examples
>>> from colour import SDS_ILLUMINANTS
>>> illuminant = SDS_ILLUMINANTS["FL2"]
>>> plot_single_sd_colour_rendering_index_bars(illuminant)
...
(<Figure size ... with 1 Axes>, <...Axes...>)