colour.plotting.plot_thin_film_spectrum#
- colour.plotting.plot_thin_film_spectrum(n: ArrayLike, t: ArrayLike, theta: ArrayLike = 0, shape: SpectralShape = SPECTRAL_SHAPE_DEFAULT, **kwargs: Any) Tuple[Figure, Axes][source]#
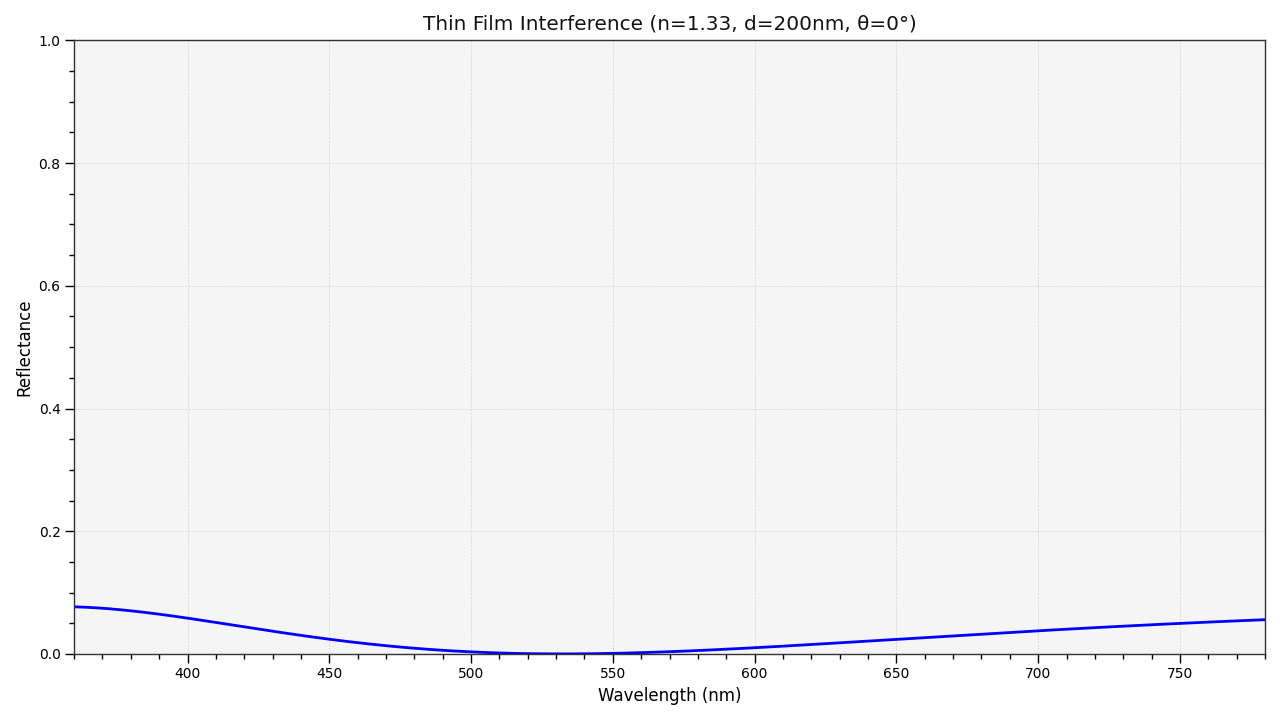
Plot reflectance spectrum of thin film using Transfer Matrix Method.
Shows the characteristic oscillating reflectance spectra seen in soap films and other thin film interference phenomena.
- Parameters:
n (ArrayLike) – Complete refractive index stack \(n_j\) for single-layer film. Shape: (3,) or (3, wavelengths_count). The array should contain [n_incident, n_film, n_substrate].
t (ArrayLike) – Film thickness \(t\) in nanometers.
theta (ArrayLike) – Incident angle \(\theta\) in degrees. Default is 0 (normal incidence).
shape (SpectralShape) – Spectral shape for wavelength sampling.
kwargs (Any) – {
colour.plotting.artist(),colour.plotting.render()}, See the documentation of the previously listed definitions.
- Returns:
Current figure and axes.
- Return type:
Examples
>>> plot_thin_film_spectrum([1.0, 1.33, 1.0], 200)
(<Figure size ... with 1 Axes>, <...Axes...>)