colour.plotting.plot_planckian_locus_in_chromaticity_diagram_CIE1931#
- colour.plotting.plot_planckian_locus_in_chromaticity_diagram_CIE1931(illuminants: str | Sequence[str] | None = None, chromaticity_diagram_callable_CIE1931: Callable = plot_chromaticity_diagram_CIE1931, annotate_kwargs: dict | List[dict] | None = None, plot_kwargs: dict | List[dict] | None = None, **kwargs: Any) Tuple[Figure, Axes][source]#
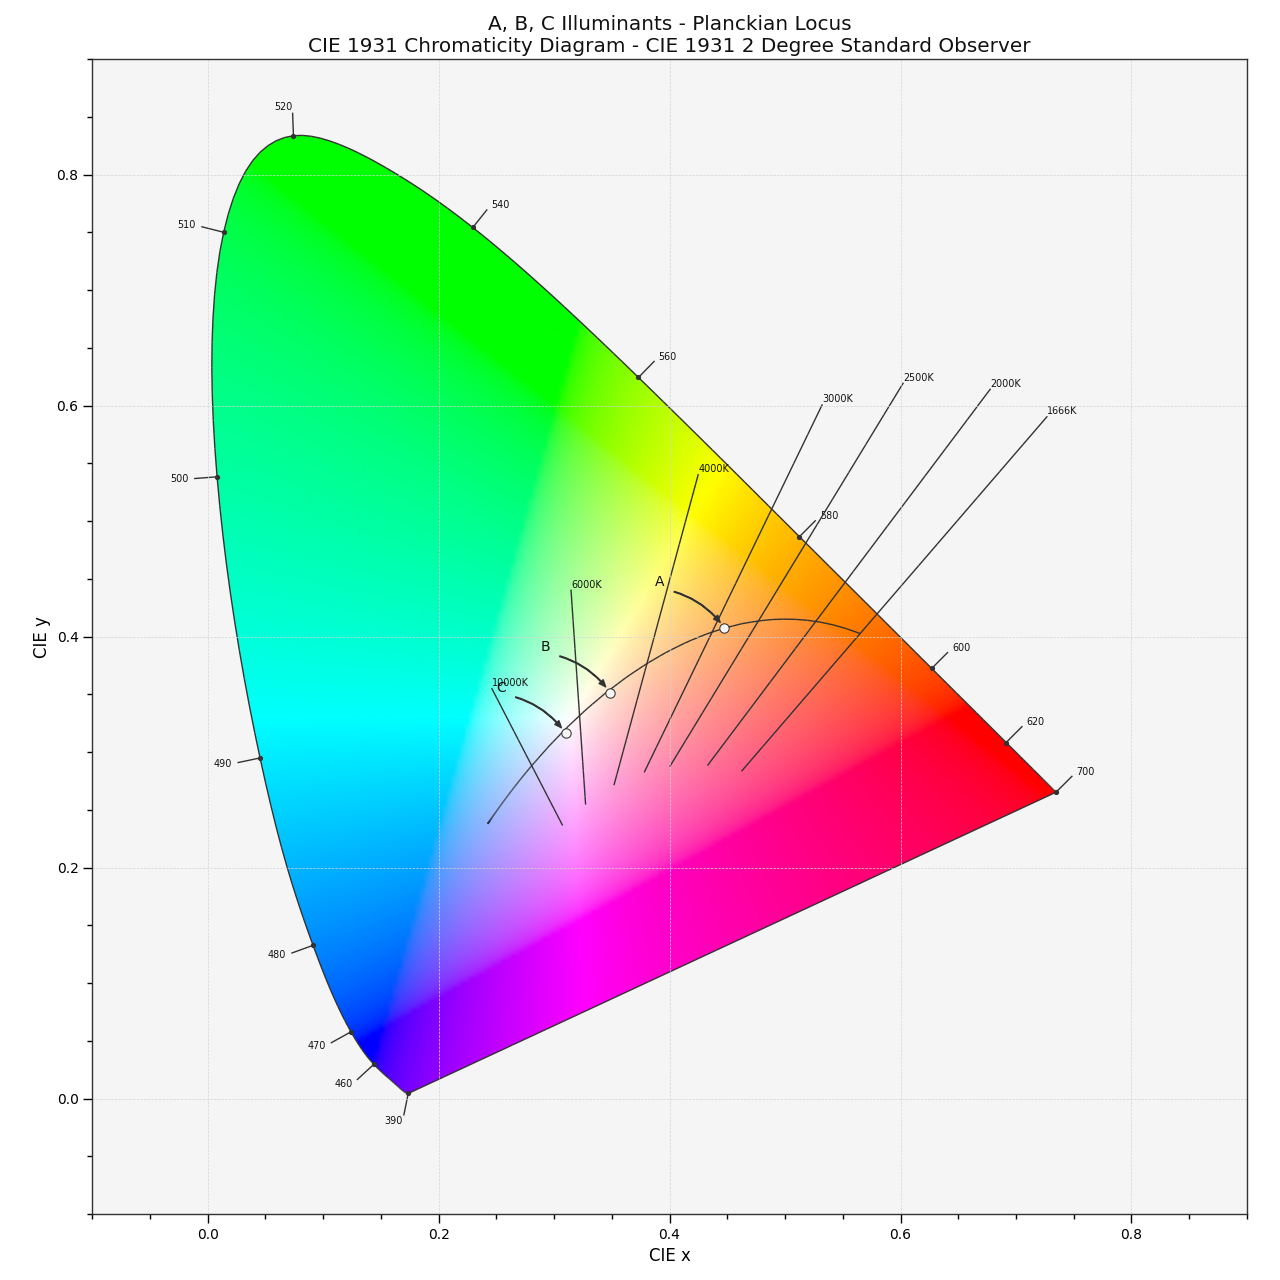
Plot the Planckian Locus and specified illuminants in the CIE 1931 Chromaticity Diagram.
- Parameters:
illuminants (str | Sequence[str] | None) – Illuminants to plot.
illuminantselements can be of any type or form supported by thecolour.plotting.common.filter_passthrough()definition.chromaticity_diagram_callable_CIE1931 (Callable) – Callable responsible for drawing the CIE 1931 Chromaticity Diagram.
annotate_kwargs (dict | List[dict] | None) –
Keyword arguments for the
matplotlib.pyplot.annotate()definition, used to annotate the resulting chromaticity coordinates with their respective spectral distribution names.annotate_kwargscan be either a single dictionary applied to all the arrows with same settings or a sequence of dictionaries with different settings for each spectral distribution. The following special keyword arguments can also be used:annotate: Whether to annotate the spectral distributions.
plot_kwargs (dict | List[dict] | None) – Keyword arguments for the
matplotlib.pyplot.plot()definition, used to control the style of the plotted illuminants.plot_kwargscan be either a single dictionary applied to all the plotted illuminants with the same settings or a sequence of dictionaries with different settings for each plotted illuminant.kwargs (Any) – {
colour.plotting.artist(),colour.plotting.diagrams.plot_chromaticity_diagram(),colour.plotting.temperature.plot_planckian_locus(),colour.plotting.temperature.plot_planckian_locus_in_chromaticity_diagram(),colour.plotting.render()}, See the documentation of the previously listed definitions.
- Returns:
Current figure and axes.
- Return type:
Examples
>>> plot_planckian_locus_in_chromaticity_diagram_CIE1931(["A", "B", "C"])
...
(<Figure size ... with 1 Axes>, <...Axes...>)