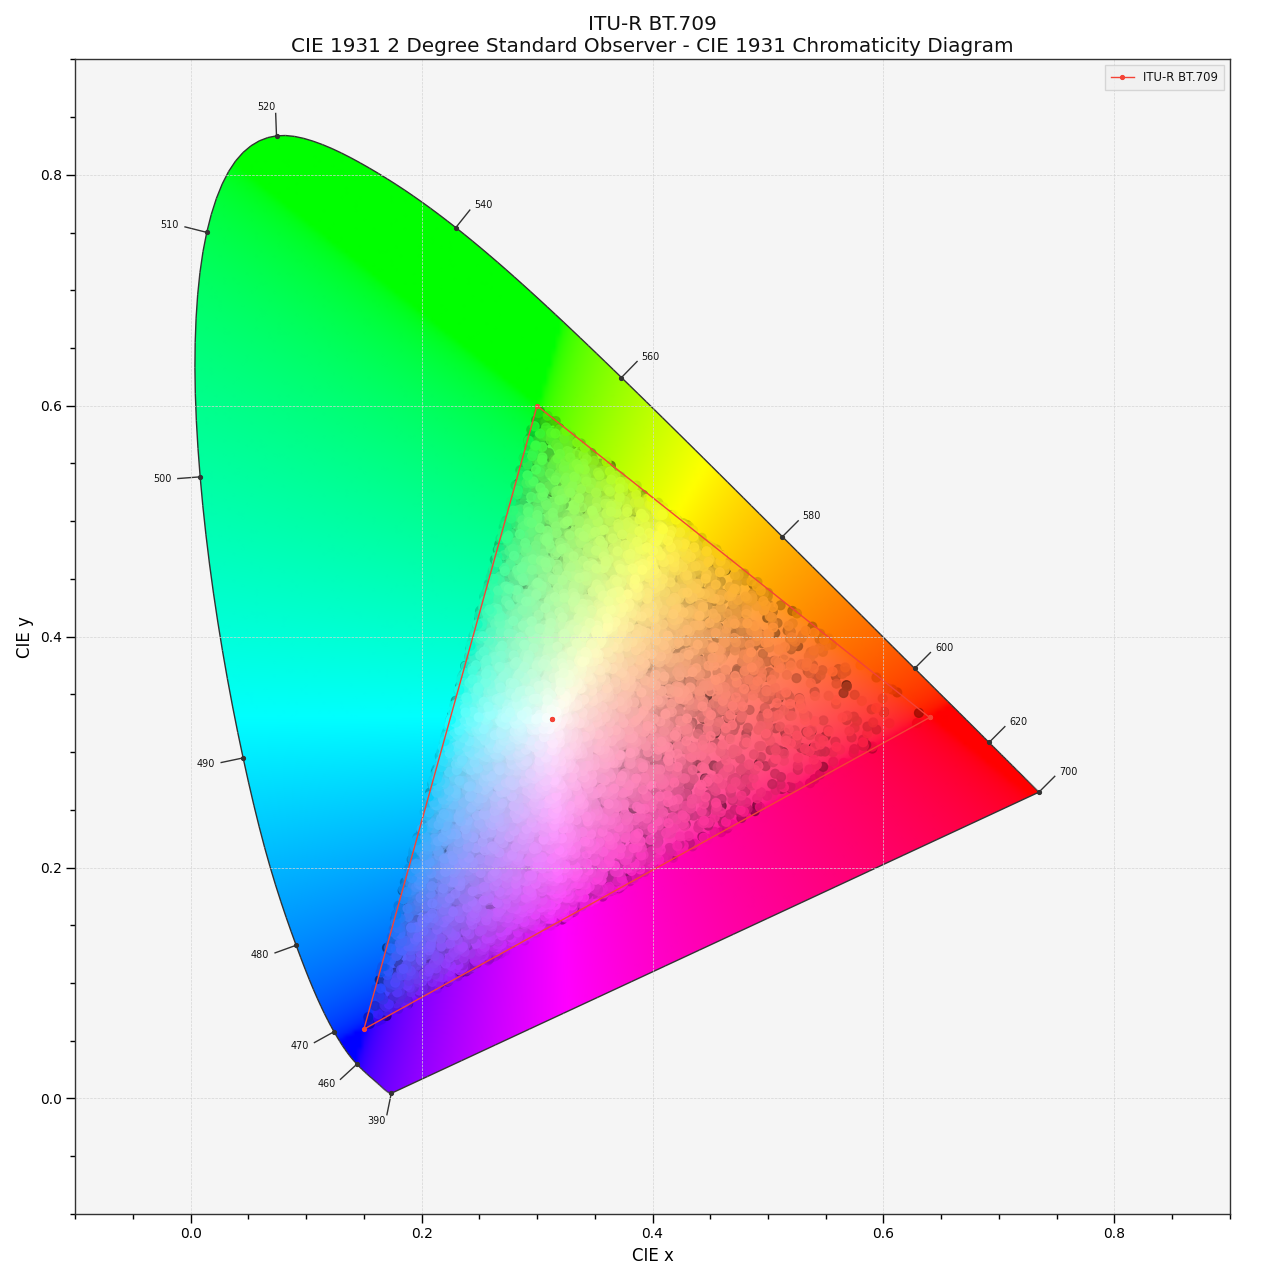
colour.plotting.models.plot_RGB_chromaticities_in_chromaticity_diagram#
- colour.plotting.models.plot_RGB_chromaticities_in_chromaticity_diagram(RGB: ArrayLike, colourspace: RGB_Colourspace | str | Sequence[RGB_Colourspace | Literal['ACES2065-1', 'ACEScc', 'ACEScct', 'ACEScg', 'ACESproxy', 'ALEXA Wide Gamut', 'ARRI Wide Gamut 3', 'ARRI Wide Gamut 4', 'Adobe RGB (1998)', 'Adobe Wide Gamut RGB', 'Apple RGB', 'Best RGB', 'Beta RGB', 'Blackmagic Wide Gamut', 'CIE RGB', 'Cinema Gamut', 'ColorMatch RGB', 'DCDM XYZ', 'DCI-P3', 'DCI-P3-P', 'DJI D-Gamut', 'DRAGONcolor', 'DRAGONcolor2', 'DaVinci Wide Gamut', 'Display P3', 'Don RGB 4', 'EBU Tech. 3213-E', 'ECI RGB v2', 'ERIMM RGB', 'Ekta Space PS 5', 'F-Gamut', 'FilmLight E-Gamut', 'ITU-R BT.2020', 'ITU-R BT.470 - 525', 'ITU-R BT.470 - 625', 'ITU-R BT.709', 'ITU-T H.273 - 22 Unspecified', 'ITU-T H.273 - Generic Film', 'Max RGB', 'N-Gamut', 'NTSC (1953)', 'NTSC (1987)', 'P3-D65', 'PLASA ANSI E1.54', 'Pal/Secam', 'ProPhoto RGB', 'Protune Native', 'REDWideGamutRGB', 'REDcolor', 'REDcolor2', 'REDcolor3', 'REDcolor4', 'RIMM RGB', 'ROMM RGB', 'Russell RGB', 'S-Gamut', 'S-Gamut3', 'S-Gamut3.Cine', 'SMPTE 240M', 'SMPTE C', 'Sharp RGB', 'V-Gamut', 'Venice S-Gamut3', 'Venice S-Gamut3.Cine', 'Xtreme RGB', 'aces', 'adobe1998', 'prophoto', 'sRGB'] | str] = 'sRGB', chromaticity_diagram_callable: Callable = plot_RGB_colourspaces_in_chromaticity_diagram, method: Literal['CIE 1931', 'CIE 1960 UCS', 'CIE 1976 UCS'] | str = 'CIE 1931', scatter_kwargs: dict | None = None, **kwargs: Any) Tuple[Figure, Axes][source]#
Plot given RGB colourspace array in the Chromaticity Diagram according to given method.
- Parameters:
RGB (ArrayLike) – RGB colourspace array.
colourspace (RGB_Colourspace | str | Sequence[RGB_Colourspace | Literal['ACES2065-1', 'ACEScc', 'ACEScct', 'ACEScg', 'ACESproxy', 'ALEXA Wide Gamut', 'ARRI Wide Gamut 3', 'ARRI Wide Gamut 4', 'Adobe RGB (1998)', 'Adobe Wide Gamut RGB', 'Apple RGB', 'Best RGB', 'Beta RGB', 'Blackmagic Wide Gamut', 'CIE RGB', 'Cinema Gamut', 'ColorMatch RGB', 'DCDM XYZ', 'DCI-P3', 'DCI-P3-P', 'DJI D-Gamut', 'DRAGONcolor', 'DRAGONcolor2', 'DaVinci Wide Gamut', 'Display P3', 'Don RGB 4', 'EBU Tech. 3213-E', 'ECI RGB v2', 'ERIMM RGB', 'Ekta Space PS 5', 'F-Gamut', 'FilmLight E-Gamut', 'ITU-R BT.2020', 'ITU-R BT.470 - 525', 'ITU-R BT.470 - 625', 'ITU-R BT.709', 'ITU-T H.273 - 22 Unspecified', 'ITU-T H.273 - Generic Film', 'Max RGB', 'N-Gamut', 'NTSC (1953)', 'NTSC (1987)', 'P3-D65', 'PLASA ANSI E1.54', 'Pal/Secam', 'ProPhoto RGB', 'Protune Native', 'REDWideGamutRGB', 'REDcolor', 'REDcolor2', 'REDcolor3', 'REDcolor4', 'RIMM RGB', 'ROMM RGB', 'Russell RGB', 'S-Gamut', 'S-Gamut3', 'S-Gamut3.Cine', 'SMPTE 240M', 'SMPTE C', 'Sharp RGB', 'V-Gamut', 'Venice S-Gamut3', 'Venice S-Gamut3.Cine', 'Xtreme RGB', 'aces', 'adobe1998', 'prophoto', 'sRGB'] | str]) – RGB colourspace of the RGB array.
colourspacecan be of any type or form supported by thecolour.plotting.common.filter_RGB_colourspaces()definition.chromaticity_diagram_callable (Callable) – Callable responsible for drawing the Chromaticity Diagram.
method (Literal['CIE 1931', 'CIE 1960 UCS', 'CIE 1976 UCS'] | str) – Chromaticity Diagram method.
scatter_kwargs (dict | None) –
Keyword arguments for the
matplotlib.pyplot.scatter()definition. The following special keyword arguments can also be used:c: Ifcis set to RGB, the scatter will use the colours as given by theRGBargument.apply_cctf_encoding: Ifapply_cctf_encodingis set to False, the encoding colour component transfer function / opto-electronic transfer function is not applied when encoding the samples to the plotting space.
kwargs (Any) – {
colour.plotting.artist(),colour.plotting.diagrams.plot_chromaticity_diagram(),colour.plotting.models.plot_RGB_colourspaces_in_chromaticity_diagram(),colour.plotting.render()}, See the documentation of the previously listed definitions.
- Returns:
Current figure and axes.
- Return type:
Examples
>>> RGB = np.random.random((128, 128, 3))
>>> plot_RGB_chromaticities_in_chromaticity_diagram(RGB, "ITU-R BT.709")
...
(<Figure size ... with 1 Axes>, <...Axes...>)
