colour.plotting.plot_RGB_colourspaces_gamuts#
- colour.plotting.plot_RGB_colourspaces_gamuts(colourspaces: RGB_Colourspace | LiteralRGBColourspace | str | Sequence[RGB_Colourspace | LiteralRGBColourspace | str], model: LiteralColourspaceModel | str = 'CIE xyY', segments: int = 8, show_grid: bool = True, grid_segments: int = 10, show_spectral_locus: bool = False, spectral_locus_colour: ArrayLike | str | None = None, cmfs: MultiSpectralDistributions | str | Sequence[MultiSpectralDistributions | str] = 'CIE 1931 2 Degree Standard Observer', chromatically_adapt: bool = False, convert_kwargs: dict | None = None, **kwargs: Any) Tuple[Figure, Axes3D][source]#
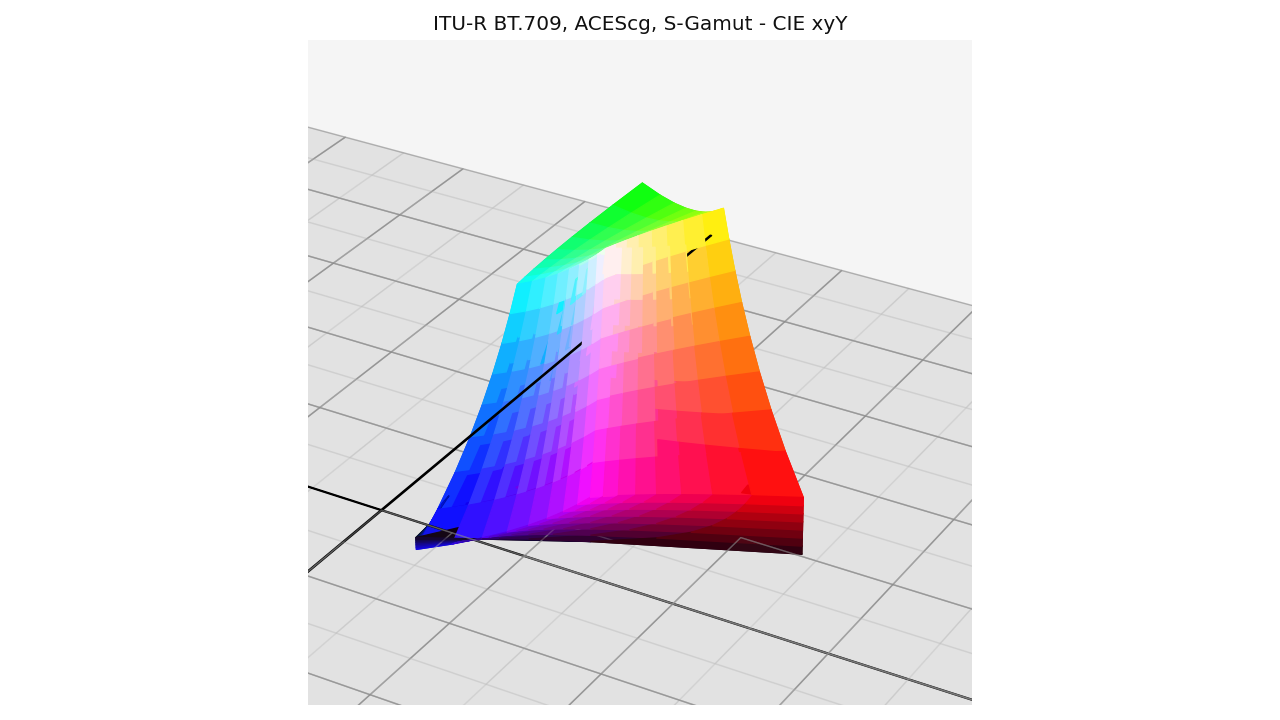
Plot the gamuts of the specified RGB colourspaces in the specified reference colourspace.
- Parameters:
colourspaces (RGB_Colourspace | LiteralRGBColourspace | str | Sequence[RGB_Colourspace | LiteralRGBColourspace | str]) – RGB colourspaces to plot the gamuts of.
colourspaceselements can be of any type or form supported by thecolour.plotting.common.filter_RGB_colourspaces()definition.model (LiteralColourspaceModel | str) – Colourspace model, see
colour.COLOURSPACE_MODELSattribute for the list of supported colourspace models.segments (int) – Edge segments count for each RGB colourspace cube.
show_grid (bool) – Whether to show a grid at the bottom of the RGB colourspace cubes.
grid_segments (int) – Edge segments count for the grid.
show_spectral_locus (bool) – Whether to show the spectral locus.
spectral_locus_colour (ArrayLike | str | None) – Spectral locus colour.
cmfs (MultiSpectralDistributions | str | Sequence[MultiSpectralDistributions | str]) – Standard observer colour matching functions used for computing the spectral locus boundaries.
cmfscan be of any type or form supported by thecolour.plotting.common.filter_cmfs()definition.chromatically_adapt (bool) – Whether to chromatically adapt the RGB colourspaces specified in
colourspacesto the whitepoint of the default plotting colourspace.convert_kwargs (dict | None) – Keyword arguments for the
colour.convert()definition.edge_colours – Edge colours array such as edge_colours = (None, (0.5, 0.5, 1.0)).
edge_alpha – Edge opacity value such as edge_alpha = (0.0, 1.0).
face_alpha – Face opacity value such as face_alpha = (0.5, 1.0).
face_colours – Face colours array such as face_colours = (None, (0.5, 0.5, 1.0)).
kwargs (Any) – {
colour.plotting.artist(),colour.plotting.volume.nadir_grid()}, See the documentation of the previously listed definitions.
- Returns:
Current figure and axes.
- Return type:
Examples
>>> plot_RGB_colourspaces_gamuts(["ITU-R BT.709", "ACEScg", "S-Gamut"])
...
(<Figure size ... with 1 Axes>, <...Axes3D...>)