colour.plotting.section.plot_hull_section_contour#
- colour.plotting.section.plot_hull_section_contour(hull: trimesh.Trimesh, model: LiteralColourspaceModel | str = 'CIE xyY', axis: Literal['+z', '+x', '+y'] | str = '+z', origin: float = 0.5, normalise: bool = True, contour_colours: ArrayLike | str | None = None, contour_opacity: float = 1, convert_kwargs: dict | None = None, **kwargs: Any) Tuple[Figure, Axes][source]#
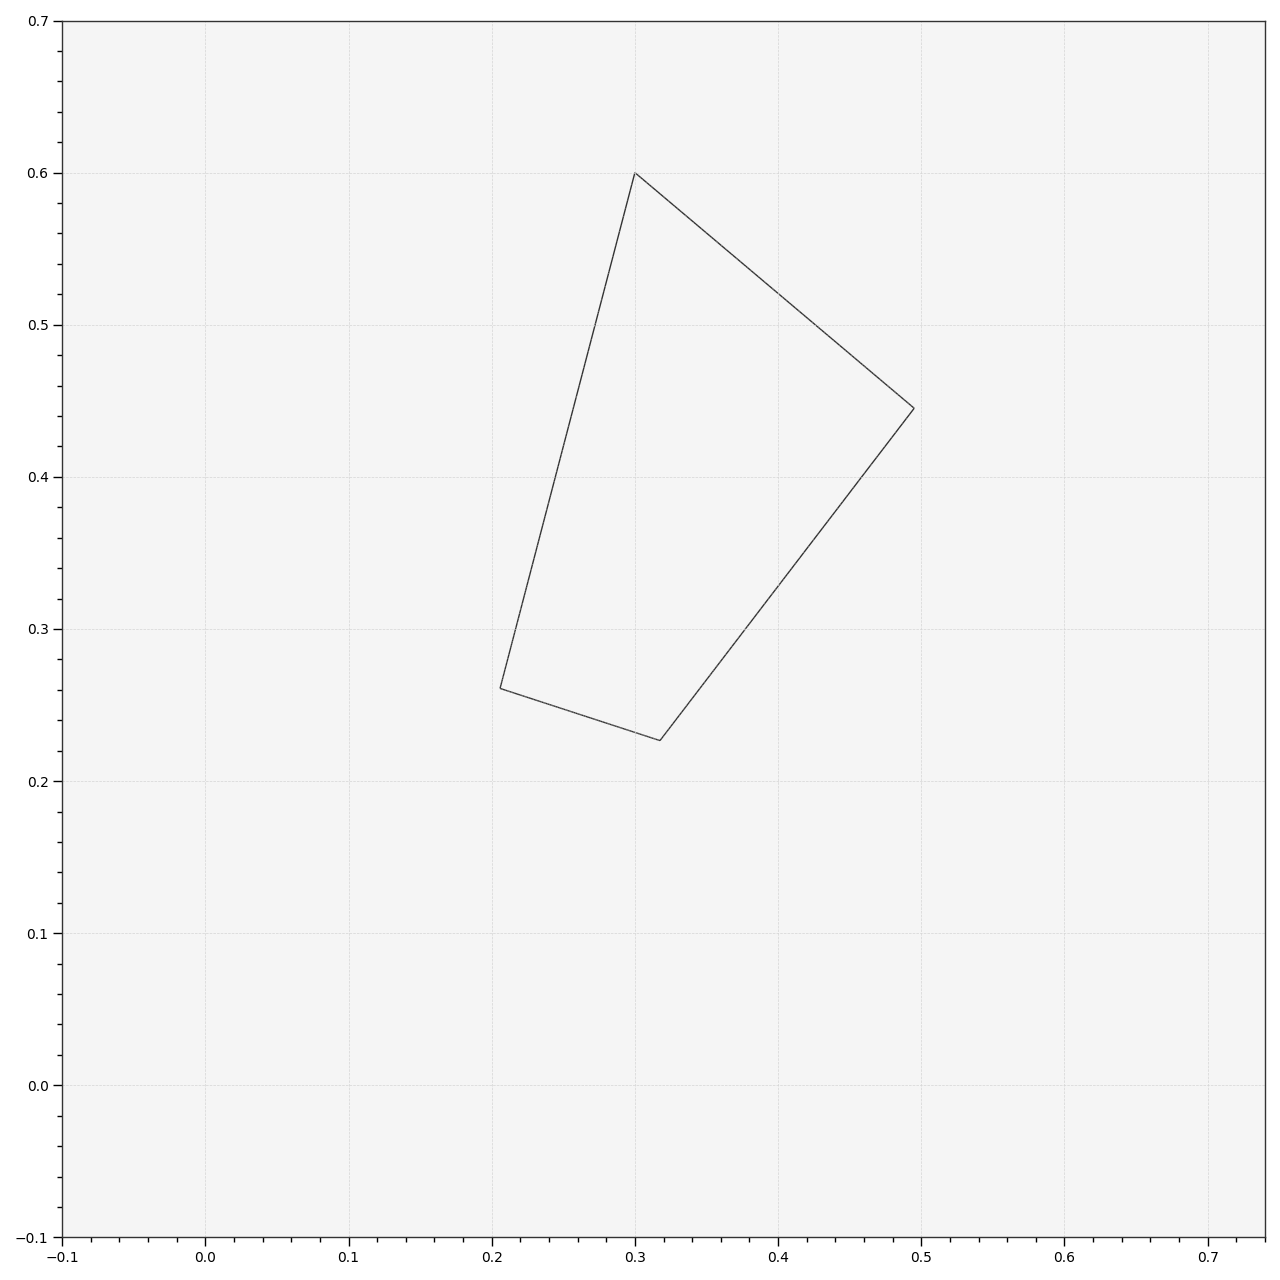
Plot the section contour of the specified trimesh hull along the specified axis and origin.
- Parameters:
hull (trimesh.Trimesh) – Trimesh hull.
model (LiteralColourspaceModel | str) – Colourspace model, see
colour.COLOURSPACE_MODELSattribute for the list of supported colourspace models.axis (Literal['+z', '+x', '+y'] | str) – Axis the hull section will be normal to.
origin (float) – Coordinate along
axisat which to plot the hull section.normalise (bool) – Whether to normalise
axisto the extent of the hull along it.contour_colours (ArrayLike | str | None) – Colours of the hull section contour, if
contour_coloursis set to RGB, the colours will be computed using the corresponding coordinates.contour_opacity (float) – Opacity of the hull section contour.
convert_kwargs (dict | None) – Keyword arguments for the
colour.convert()definition.kwargs (Any) – {
colour.plotting.artist(),colour.plotting.render()}, See the documentation of the previously listed definitions.
- Returns:
Current figure and axes.
- Return type:
Examples
>>> from colour.models import RGB_COLOURSPACE_sRGB
>>> from colour.utilities import is_trimesh_installed
>>> vertices, faces, _outline = primitive_cube(1, 1, 1, 64, 64, 64)
>>> XYZ_vertices = RGB_to_XYZ(vertices["position"] + 0.5, RGB_COLOURSPACE_sRGB)
>>> if is_trimesh_installed:
...     from trimesh import Trimesh
...
...     hull = Trimesh(XYZ_vertices, faces, process=False)
...     plot_hull_section_contour(hull, contour_colours="RGB")
...
(<Figure size ... with 1 Axes>, <...Axes...>)