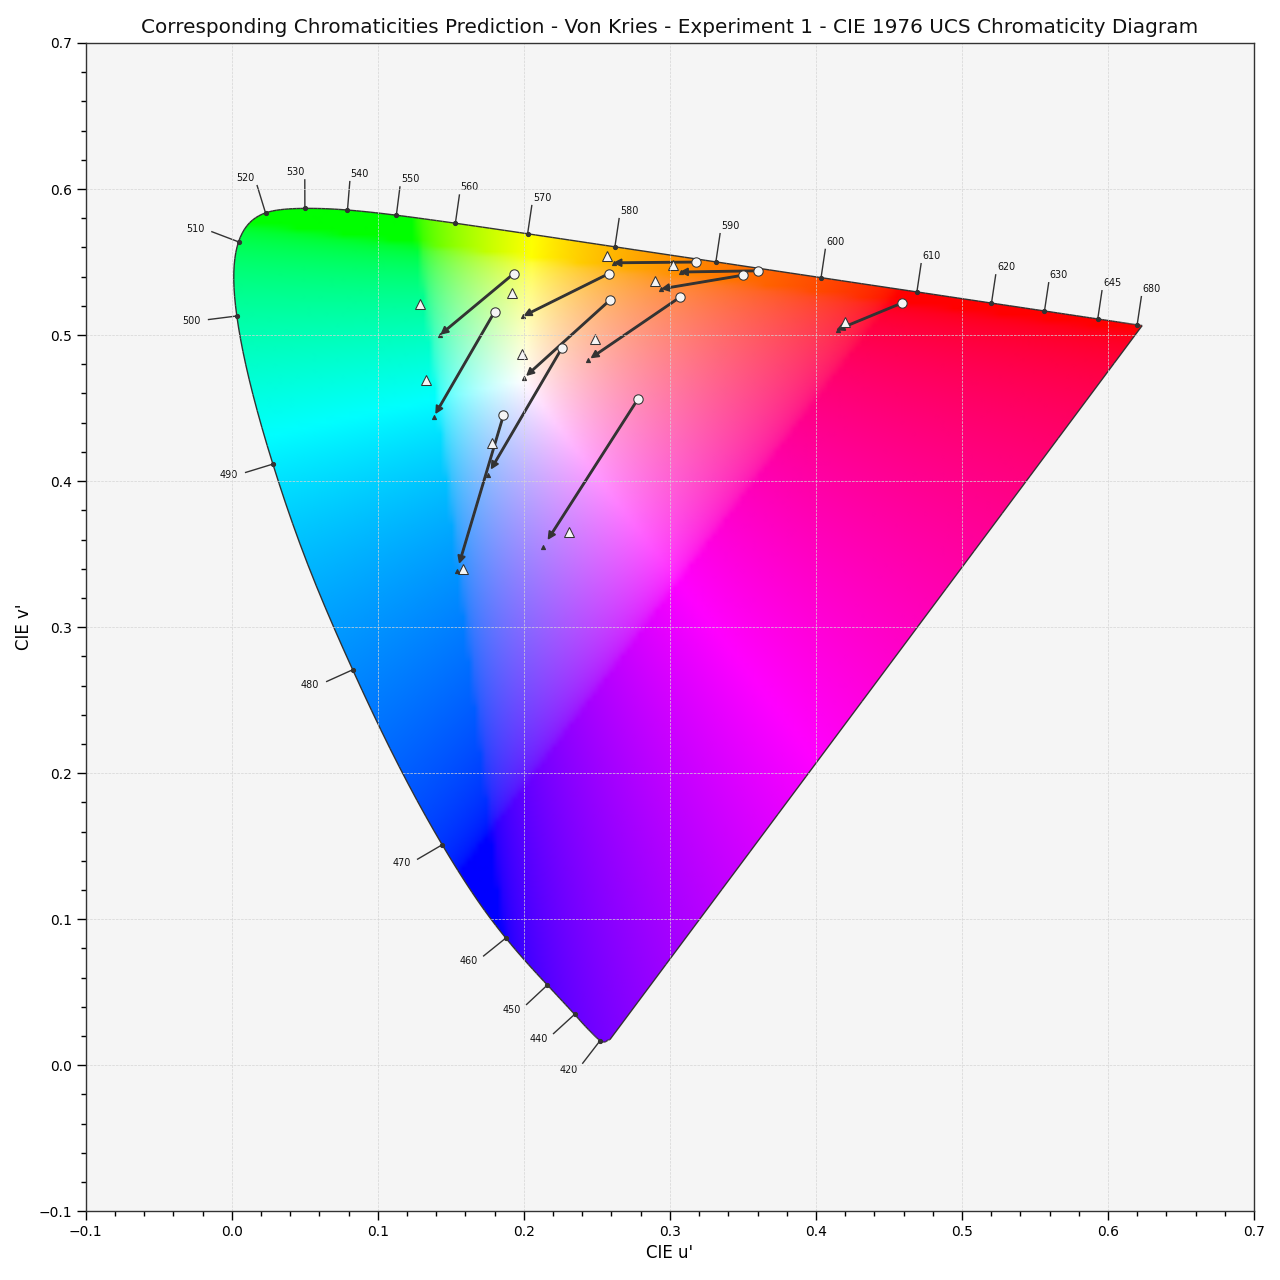
colour.plotting.plot_corresponding_chromaticities_prediction#
- colour.plotting.plot_corresponding_chromaticities_prediction(experiment: Literal[1, 2, 3, 4, 6, 8, 9, 11, 12] | CorrespondingColourDataset = 1, model: Literal['CIE 1994', 'CMCCAT2000', 'Fairchild 1990', 'Von Kries', 'Zhai 2018'] | str = 'Von Kries', corresponding_chromaticities_prediction_kwargs: dict | None = None, **kwargs: Any) Tuple[Figure, Axes][source]#
Plot the corresponding chromaticities prediction for the specified chromatic adaptation model.
- Parameters:
experiment (Literal[1, 2, 3, 4, 6, 8, 9, 11, 12] | CorrespondingColourDataset) – Breneman (1987) experiment number or
colour.CorrespondingColourDatasetclass instance.model (Literal['CIE 1994', 'CMCCAT2000', 'Fairchild 1990', 'Von Kries', 'Zhai 2018'] | str) – Corresponding chromaticities prediction model name.
corresponding_chromaticities_prediction_kwargs (dict | None) – Keyword arguments for the
colour.corresponding_chromaticities_prediction()definition.kwargs (Any) – {
colour.plotting.artist(),colour.plotting.diagrams.plot_chromaticity_diagram(),colour.plotting.render()}, See the documentation of the previously listed definitions.
- Returns:
Current figure and axes.
- Return type:
Examples
>>> plot_corresponding_chromaticities_prediction(1, "Von Kries")
...
(<Figure size ... with 1 Axes>, <...Axes...>)