colour.plotting.plot_RGB_colourspaces_gamuts
- colour.plotting.plot_RGB_colourspaces_gamuts(colourspaces: Union[RGB_Colourspace, str, Sequence[Union[RGB_Colourspace, str]]], reference_colourspace: Union[Literal['CAM02LCD', 'CAM02SCD', 'CAM02UCS', 'CAM16LCD', 'CAM16SCD', 'CAM16UCS', 'CIE XYZ', 'CIE xyY', 'CIE Lab', 'CIE Luv', 'CIE UCS', 'CIE UVW', 'DIN99', 'Hunter Lab', 'Hunter Rdab', 'ICaCb', 'ICtCp', 'IPT', 'IgPgTg', 'Jzazbz', 'OSA UCS', 'Oklab', 'hdr-CIELAB', 'hdr-IPT'], str] = 'CIE xyY', segments: Integer = 8, show_grid: Boolean = True, grid_segments: Integer = 10, show_spectral_locus: Boolean = False, spectral_locus_colour: Optional[Union[ArrayLike, str]] = None, cmfs: Union[MultiSpectralDistributions, str, Sequence[Union[MultiSpectralDistributions, str]]] = 'CIE 1931 2 Degree Standard Observer', chromatically_adapt: Boolean = False, convert_kwargs: Optional[Dict] = None, **kwargs: Any) Tuple[plt.Figure, plt.Axes][source]
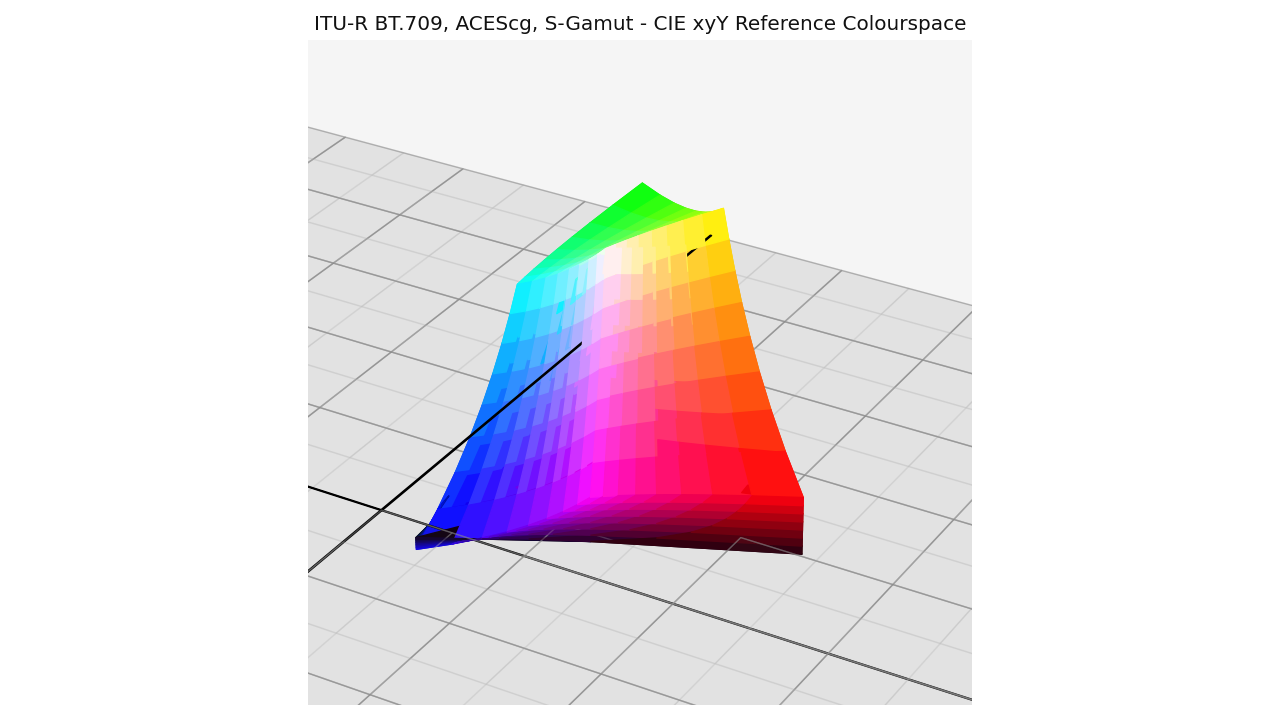
Plot given RGB colourspaces gamuts in given reference colourspace.
- Parameters
colourspaces (Union[RGB_Colourspace, str, Sequence[Union[RGB_Colourspace, str]]]) – RGB colourspaces to plot the gamuts.
colourspaceselements can be of any type or form supported by thecolour.plotting.filter_RGB_colourspaces()definition.reference_colourspace (Union[Literal[('CAM02LCD', 'CAM02SCD', 'CAM02UCS', 'CAM16LCD', 'CAM16SCD', 'CAM16UCS', 'CIE XYZ', 'CIE xyY', 'CIE Lab', 'CIE Luv', 'CIE UCS', 'CIE UVW', 'DIN99', 'Hunter Lab', 'Hunter Rdab', 'ICaCb', 'ICtCp', 'IPT', 'IgPgTg', 'Jzazbz', 'OSA UCS', 'Oklab', 'hdr-CIELAB', 'hdr-IPT')], str]) – Reference colourspace model to plot the gamuts into, see
colour.COLOURSPACE_MODELSattribute for the list of supported colourspace models.segments (Integer) – Edge segments count for each RGB colourspace cubes.
show_grid (Boolean) – Whether to show a grid at the bottom of the RGB colourspace cubes.
grid_segments (Integer) – Edge segments count for the grid.
show_spectral_locus (Boolean) – Whether to show the spectral locus.
spectral_locus_colour (Optional[Union[ArrayLike, str]]) – Spectral locus colour.
cmfs (Union[MultiSpectralDistributions, str, Sequence[Union[MultiSpectralDistributions, str]]]) – Standard observer colour matching functions used for computing the spectral locus boundaries.
cmfscan be of any type or form supported by thecolour.plotting.filter_cmfs()definition.chromatically_adapt (Boolean) – Whether to chromatically adapt the RGB colourspaces given in
colourspacesto the whitepoint of the default plotting colourspace.convert_kwargs (Optional[Dict]) – Keyword arguments for the
colour.convert()definition.edge_colours – Edge colours array such as edge_colours = (None, (0.5, 0.5, 1.0)).
edge_alpha – Edge opacity value such as edge_alpha = (0.0, 1.0).
face_alpha – Face opacity value such as face_alpha = (0.5, 1.0).
face_colours – Face colours array such as face_colours = (None, (0.5, 0.5, 1.0)).
kwargs (Any) – {
colour.plotting.artist(),colour.plotting.volume.nadir_grid()}, See the documentation of the previously listed definitions.
- Returns
Current figure and axes.
- Return type
Examples
>>> plot_RGB_colourspaces_gamuts(['ITU-R BT.709', 'ACEScg', 'S-Gamut'])
...
(<Figure size ... with 1 Axes>, <...Axes3DSubplot...>)