colour.plotting.plot_multi_functions
- colour.plotting.plot_multi_functions(functions: Dict[str, Callable], samples: Optional[ArrayLike] = None, log_x: Optional[Integer] = None, log_y: Optional[Integer] = None, plot_kwargs: Optional[Union[Dict, List[Dict]]] = None, **kwargs: Any) Tuple[plt.Figure, plt.Axes][source]
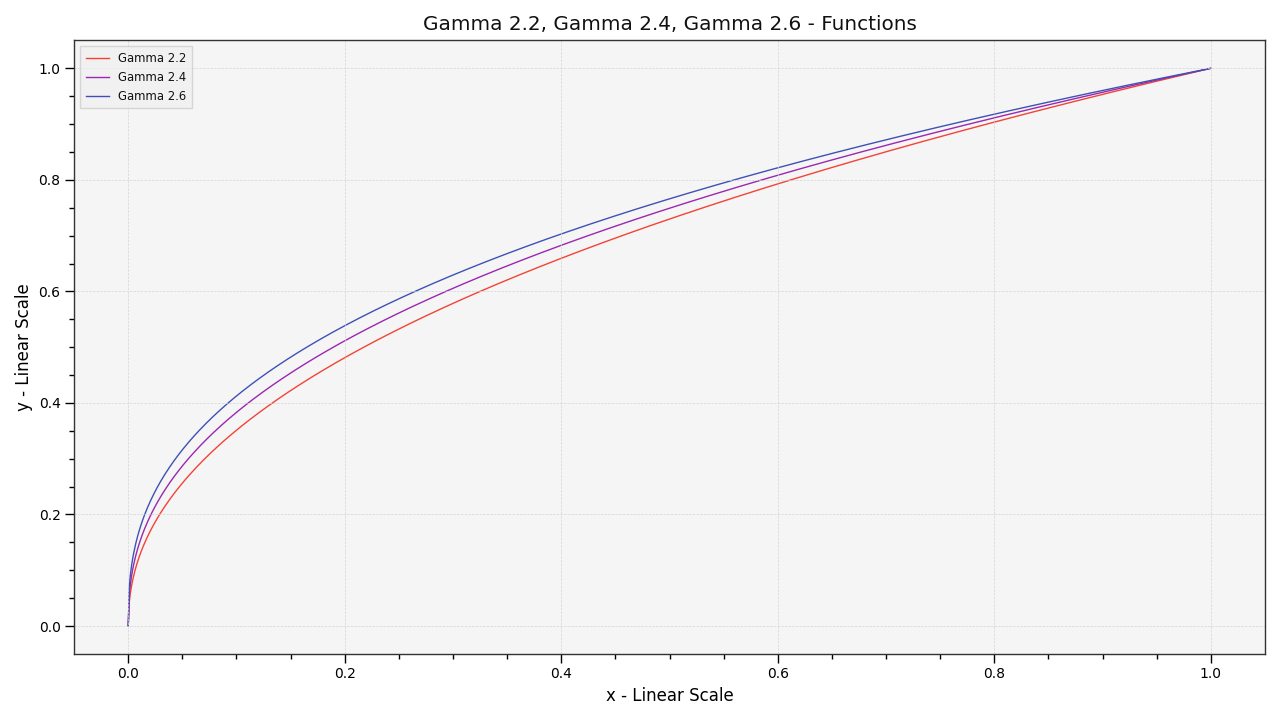
Plot given functions.
- Parameters
functions (Dict[str, Callable]) – Functions to plot.
samples (Optional[ArrayLike]) – Samples to evaluate the functions with.
log_x (Optional[Integer]) – Log base to use for the x axis scale, if None, the x axis scale will be linear.
log_y (Optional[Integer]) – Log base to use for the y axis scale, if None, the y axis scale will be linear.
plot_kwargs (Optional[Union[Dict, List[Dict]]]) – Keyword arguments for the
matplotlib.pyplot.plot()definition, used to control the style of the plotted functions.plot_kwargscan be either a single dictionary applied to all the plotted functions with the same settings or a sequence of dictionaries with different settings for each plotted function.kwargs (Any) – {
colour.plotting.artist(),colour.plotting.render()}, See the documentation of the previously listed definitions.
- Returns
Current figure and axes.
- Return type
Examples
>>> functions = {
...     'Gamma 2.2' : lambda x: x ** (1 / 2.2),
...     'Gamma 2.4' : lambda x: x ** (1 / 2.4),
...     'Gamma 2.6' : lambda x: x ** (1 / 2.6),
... }
>>> plot_multi_functions(functions)
...
(<Figure size ... with 1 Axes>, <...AxesSubplot...>)