colour.plotting.plot_automatic_colour_conversion_graph
- colour.plotting.plot_automatic_colour_conversion_graph(filename: str, prog: Union[Literal['circo', 'dot', 'fdp', 'neato', 'nop', 'twopi'], str] = 'fdp', args: str = '') AGraph[source]
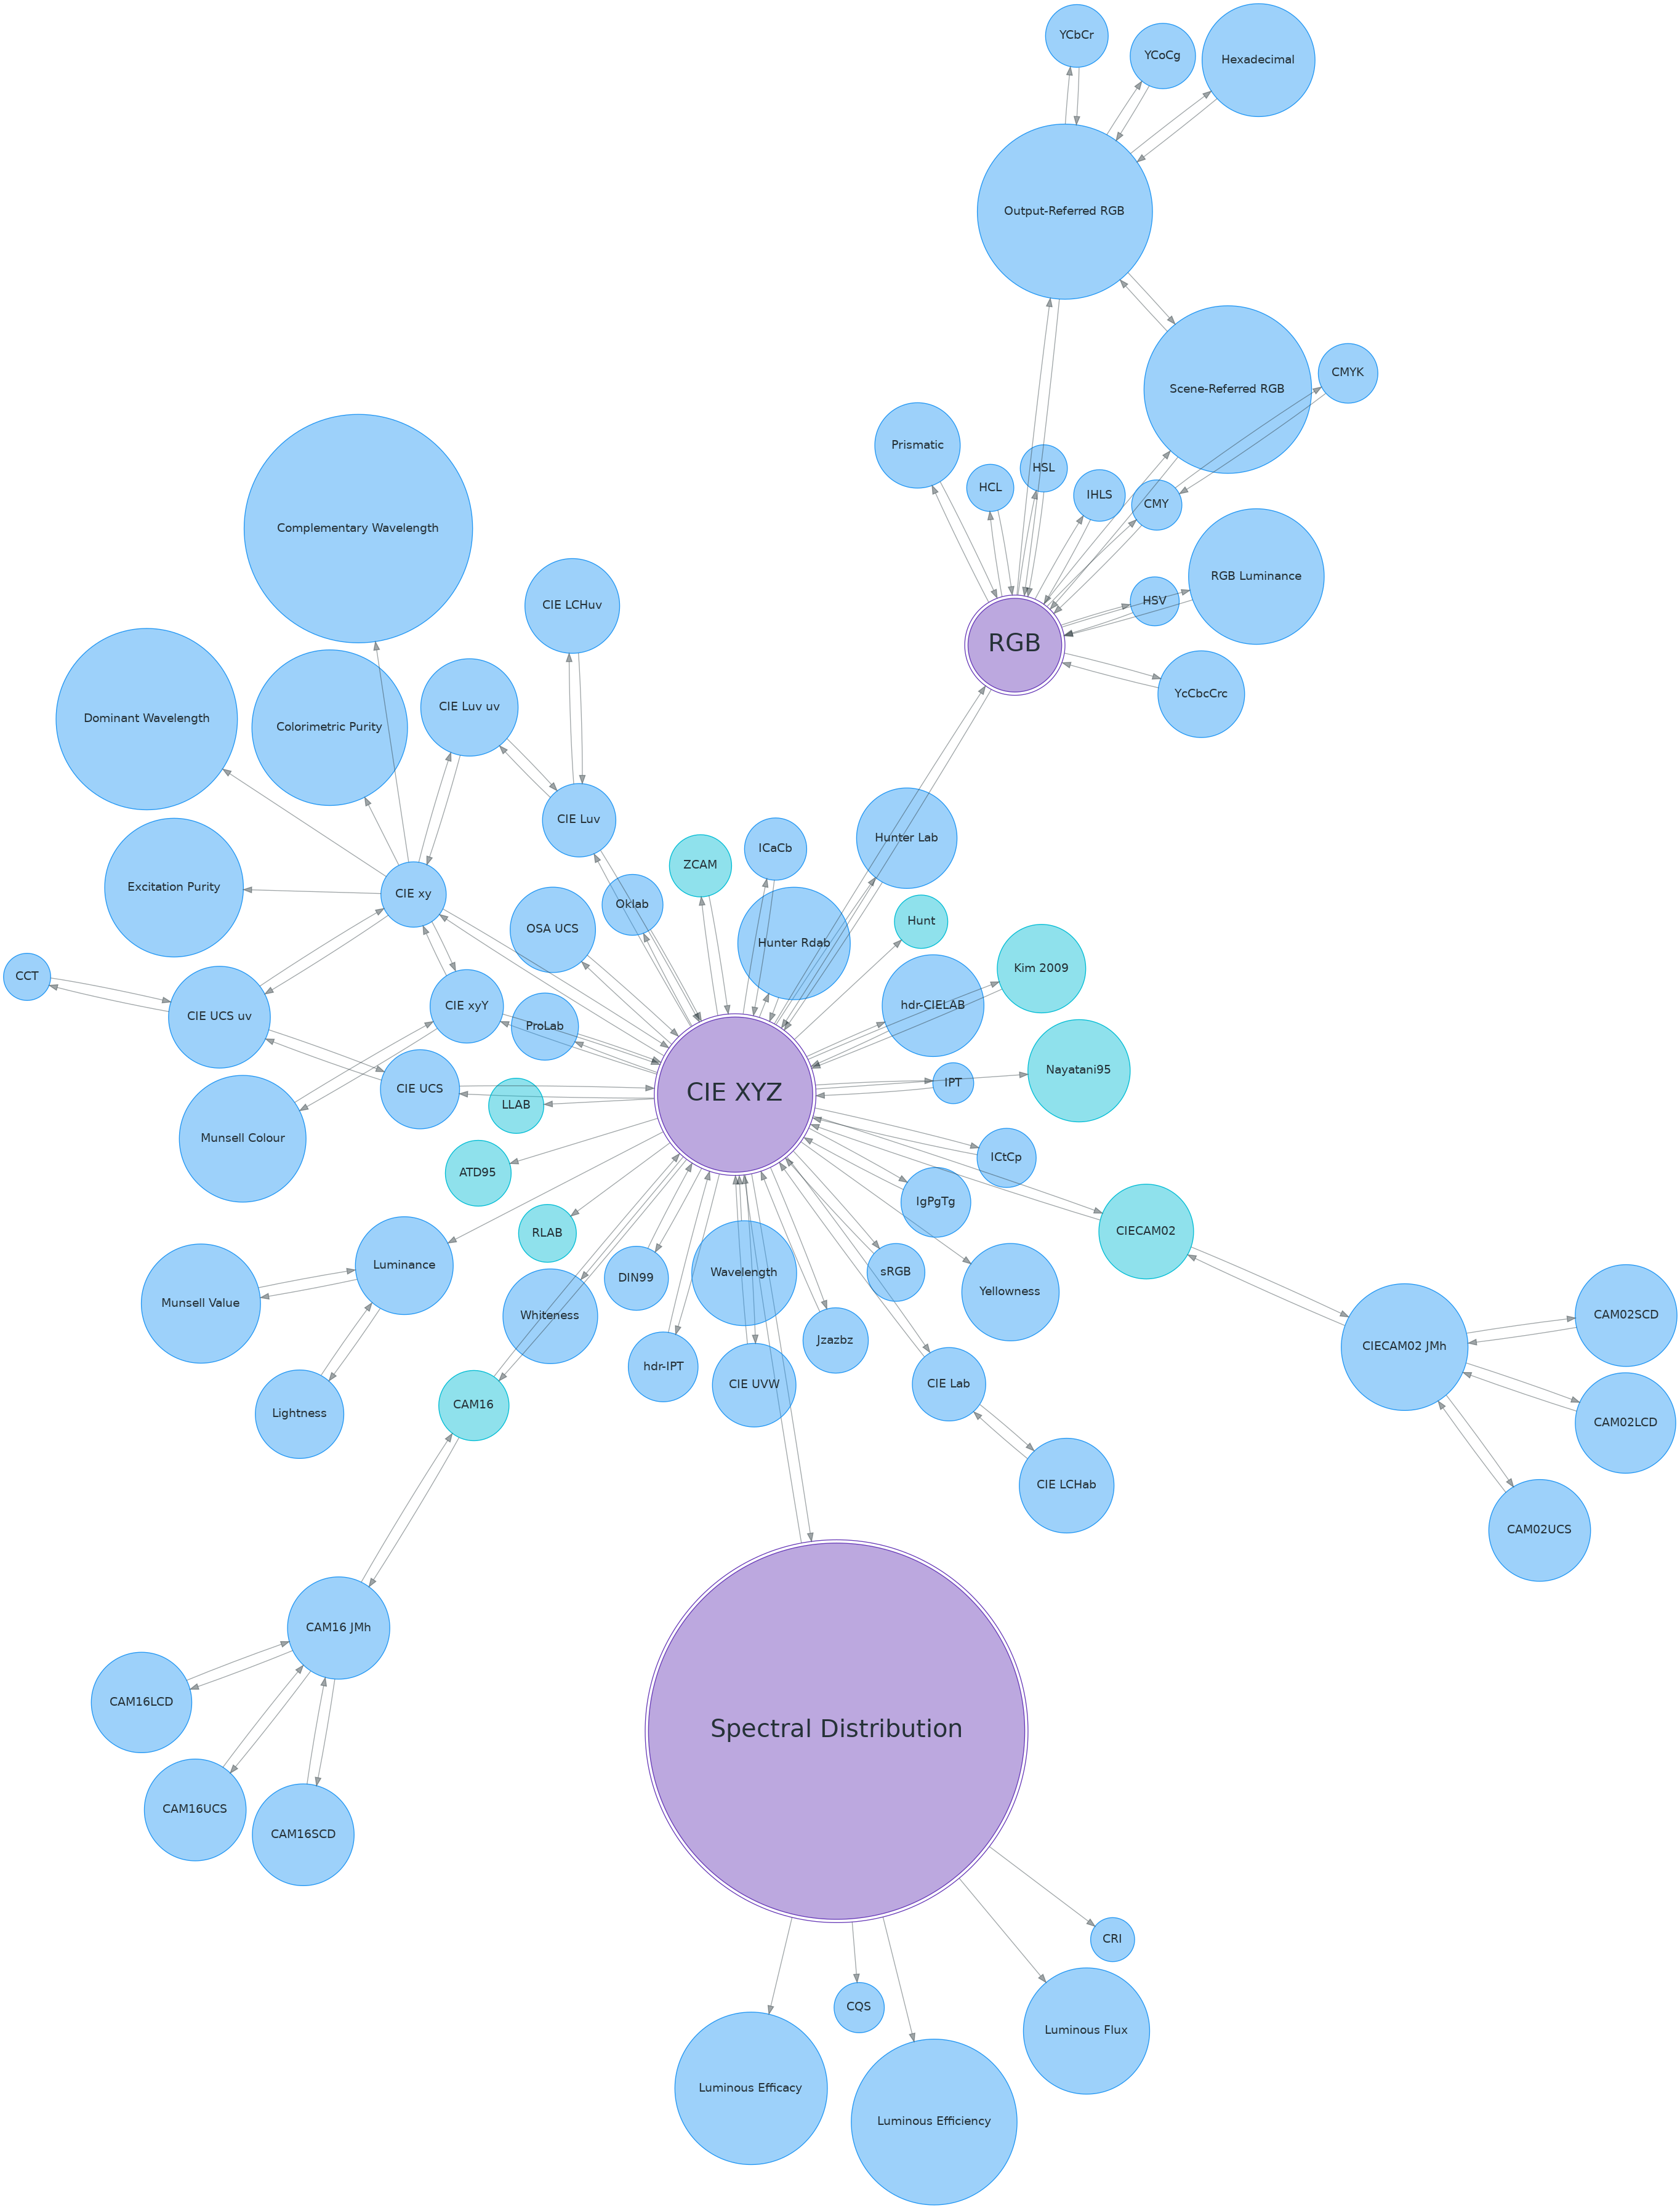
Plot Colour automatic colour conversion graph using Graphviz and pyraphviz.
- Parameters
- Returns
Pyraphviz graph.
- Return type
AGraph
Notes
This definition does not directly plot the Colour automatic colour conversion graph but instead write it to an image.
Examples
>>> import tempfile
>>> import colour
>>> from colour import read_image
>>> from colour.plotting import plot_image
>>> filename = '{0}.png'.format(tempfile.mkstemp()[-1])
>>> _ = plot_automatic_colour_conversion_graph(filename, 'dot')
...
>>> plot_image(read_image(filename))