colour.plotting.section.plot_hull_section_colours
- colour.plotting.section.plot_hull_section_colours(hull: trimesh.Trimesh, model: Union[Literal['CAM02LCD', 'CAM02SCD', 'CAM02UCS', 'CAM16LCD', 'CAM16SCD', 'CAM16UCS', 'CIE XYZ', 'CIE xyY', 'CIE Lab', 'CIE Luv', 'CIE UCS', 'CIE UVW', 'DIN99', 'Hunter Lab', 'Hunter Rdab', 'ICaCb', 'ICtCp', 'IPT', 'IgPgTg', 'Jzazbz', 'OSA UCS', 'Oklab', 'hdr-CIELAB', 'hdr-IPT'], str] = 'CIE xyY', axis: Union[Literal['+z', '+x', '+y'], str] = '+z', origin: Floating = 0.5, normalise: Boolean = True, section_colours: Optional[Union[ArrayLike, str]] = None, section_opacity: Floating = 1, convert_kwargs: Optional[Dict] = None, samples: Integer = 256, **kwargs: Any) Tuple[plt.Figure, plt.Axes][source]
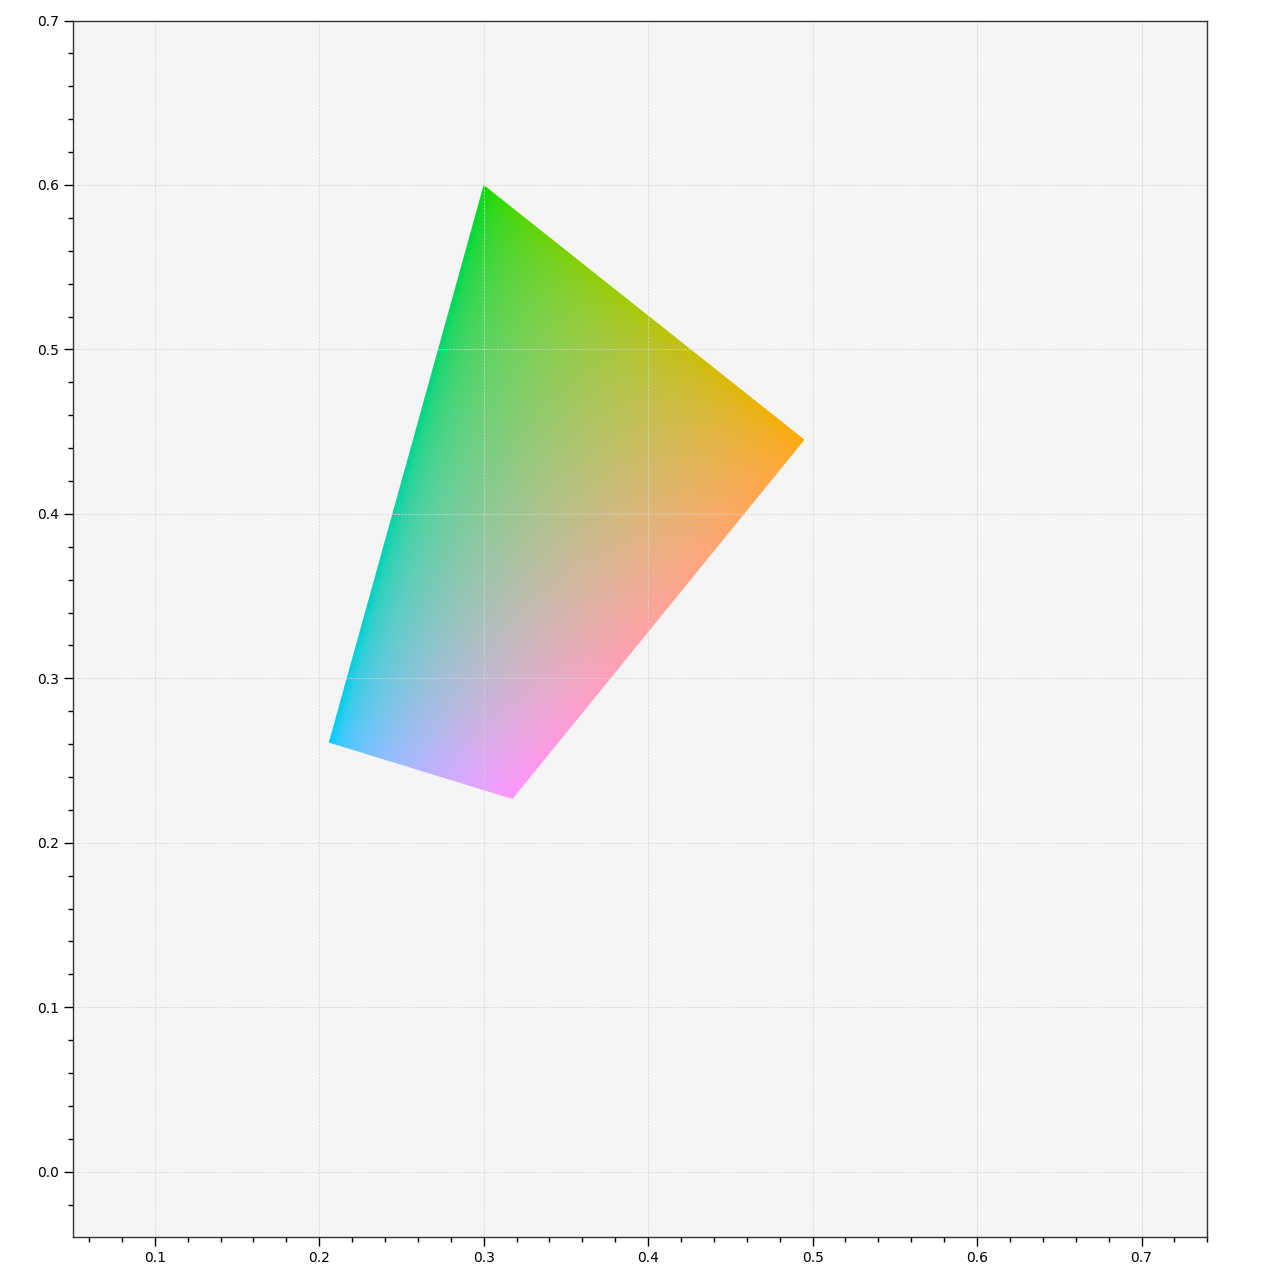
Plot the section colours of given trimesh hull along given axis and origin.
- Parameters
hull (trimesh.Trimesh) – Trimesh hull.
model (Union[Literal[('CAM02LCD', 'CAM02SCD', 'CAM02UCS', 'CAM16LCD', 'CAM16SCD', 'CAM16UCS', 'CIE XYZ', 'CIE xyY', 'CIE Lab', 'CIE Luv', 'CIE UCS', 'CIE UVW', 'DIN99', 'Hunter Lab', 'Hunter Rdab', 'ICaCb', 'ICtCp', 'IPT', 'IgPgTg', 'Jzazbz', 'OSA UCS', 'Oklab', 'hdr-CIELAB', 'hdr-IPT')], str]) – Colourspace model, see
colour.COLOURSPACE_MODELSattribute for the list of supported colourspace models.axis (Union[Literal[('+z', '+x', '+y')], str]) – Axis the hull section will be normal to.
origin (Floating) – Coordinate along
axisat which to plot the hull section.normalise (Boolean) – Whether to normalise
axisto the extent of the hull along it.section_colours (Optional[Union[ArrayLike, str]]) – Colours of the hull section, if
section_coloursis set to RGB, the colours will be computed according to the corresponding coordinates.section_opacity (Floating) – Opacity of the hull section colours.
convert_kwargs (Optional[Dict]) – Keyword arguments for the
colour.convert()definition.samples (Integer) – Samples count on one axis when computing the hull section colours.
kwargs (Any) – {
colour.plotting.artist(),colour.plotting.render()}, See the documentation of the previously listed definitions.
- Returns
Current figure and axes.
- Return type
Examples
>>> from colour.models import RGB_COLOURSPACE_sRGB
>>> from colour.utilities import is_trimesh_installed
>>> vertices, faces, _outline = primitive_cube(1, 1, 1, 64, 64, 64)
>>> XYZ_vertices = RGB_to_XYZ(
...     vertices['position'] + 0.5,
...     RGB_COLOURSPACE_sRGB.whitepoint,
...     RGB_COLOURSPACE_sRGB.whitepoint,
...     RGB_COLOURSPACE_sRGB.matrix_RGB_to_XYZ,
... )
>>> if is_trimesh_installed:
...     import trimesh
...     hull = trimesh.Trimesh(XYZ_vertices, faces, process=False)
...     plot_hull_section_colours(hull, section_colours='RGB')
...
(<Figure size ... with 1 Axes>, <...AxesSubplot...>)