colour.plotting.plot_single_sd_rayleigh_scattering
- colour.plotting.plot_single_sd_rayleigh_scattering(CO2_concentration: FloatingOrArrayLike = CONSTANT_STANDARD_CO2_CONCENTRATION, temperature: FloatingOrArrayLike = CONSTANT_STANDARD_AIR_TEMPERATURE, pressure: FloatingOrArrayLike = CONSTANT_AVERAGE_PRESSURE_MEAN_SEA_LEVEL, latitude: FloatingOrArrayLike = CONSTANT_DEFAULT_LATITUDE, altitude: FloatingOrArrayLike = CONSTANT_DEFAULT_ALTITUDE, cmfs: Union[colour.colorimetry.spectrum.MultiSpectralDistributions, str, Sequence[Union[colour.colorimetry.spectrum.MultiSpectralDistributions, str]]] = 'CIE 1931 2 Degree Standard Observer', **kwargs: Any) Tuple[matplotlib.figure.Figure, matplotlib.axes._axes.Axes][source]
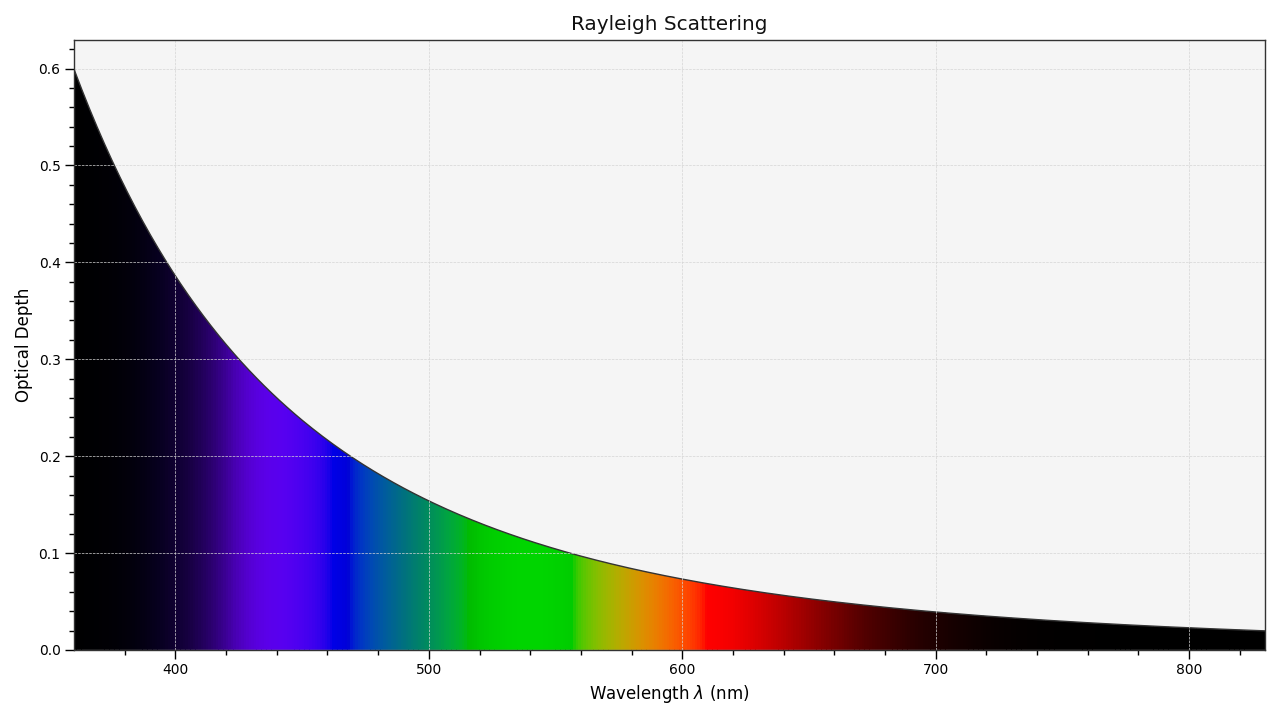
Plot a single Rayleigh scattering spectral distribution.
- Parameters
CO2_concentration (FloatingOrArrayLike) – \(CO_2\) concentration in parts per million (ppm).
temperature (FloatingOrArrayLike) – Air temperature \(T[K]\) in kelvin degrees.
pressure (FloatingOrArrayLike) – Surface pressure \(P\) of the measurement site.
latitude (FloatingOrArrayLike) – Latitude of the site in degrees.
altitude (FloatingOrArrayLike) – Altitude of the site in meters.
cmfs (Union[colour.colorimetry.spectrum.MultiSpectralDistributions, str, Sequence[Union[colour.colorimetry.spectrum.MultiSpectralDistributions, str]]]) – Standard observer colour matching functions used for computing the spectrum domain and colours.
cmfscan be of any type or form supported by thecolour.plotting.filter_cmfs()definition.kwargs (Any) – {
colour.plotting.artist(),colour.plotting.plot_single_sd(),colour.plotting.render()}, See the documentation of the previously listed definitions.
- Returns
Current figure and axes.
- Return type
Examples
>>> plot_single_sd_rayleigh_scattering()
(<Figure size ... with 1 Axes>, <...AxesSubplot...>)