colour.plotting.diagrams.plot_sds_in_chromaticity_diagram#
- colour.plotting.diagrams.plot_sds_in_chromaticity_diagram(sds: Sequence[SpectralDistribution | MultiSpectralDistributions] | SpectralDistribution | MultiSpectralDistributions | ValuesView, cmfs: MultiSpectralDistributions | str | Sequence[MultiSpectralDistributions | str] = 'CIE 1931 2 Degree Standard Observer', chromaticity_diagram_callable: Callable = plot_chromaticity_diagram, method: Literal['CIE 1931', 'CIE 1960 UCS', 'CIE 1976 UCS'] | str = 'CIE 1931', annotate_kwargs: dict | List[dict] | None = None, plot_kwargs: dict | List[dict] | None = None, **kwargs: Any) Tuple[Figure, Axes][source]#
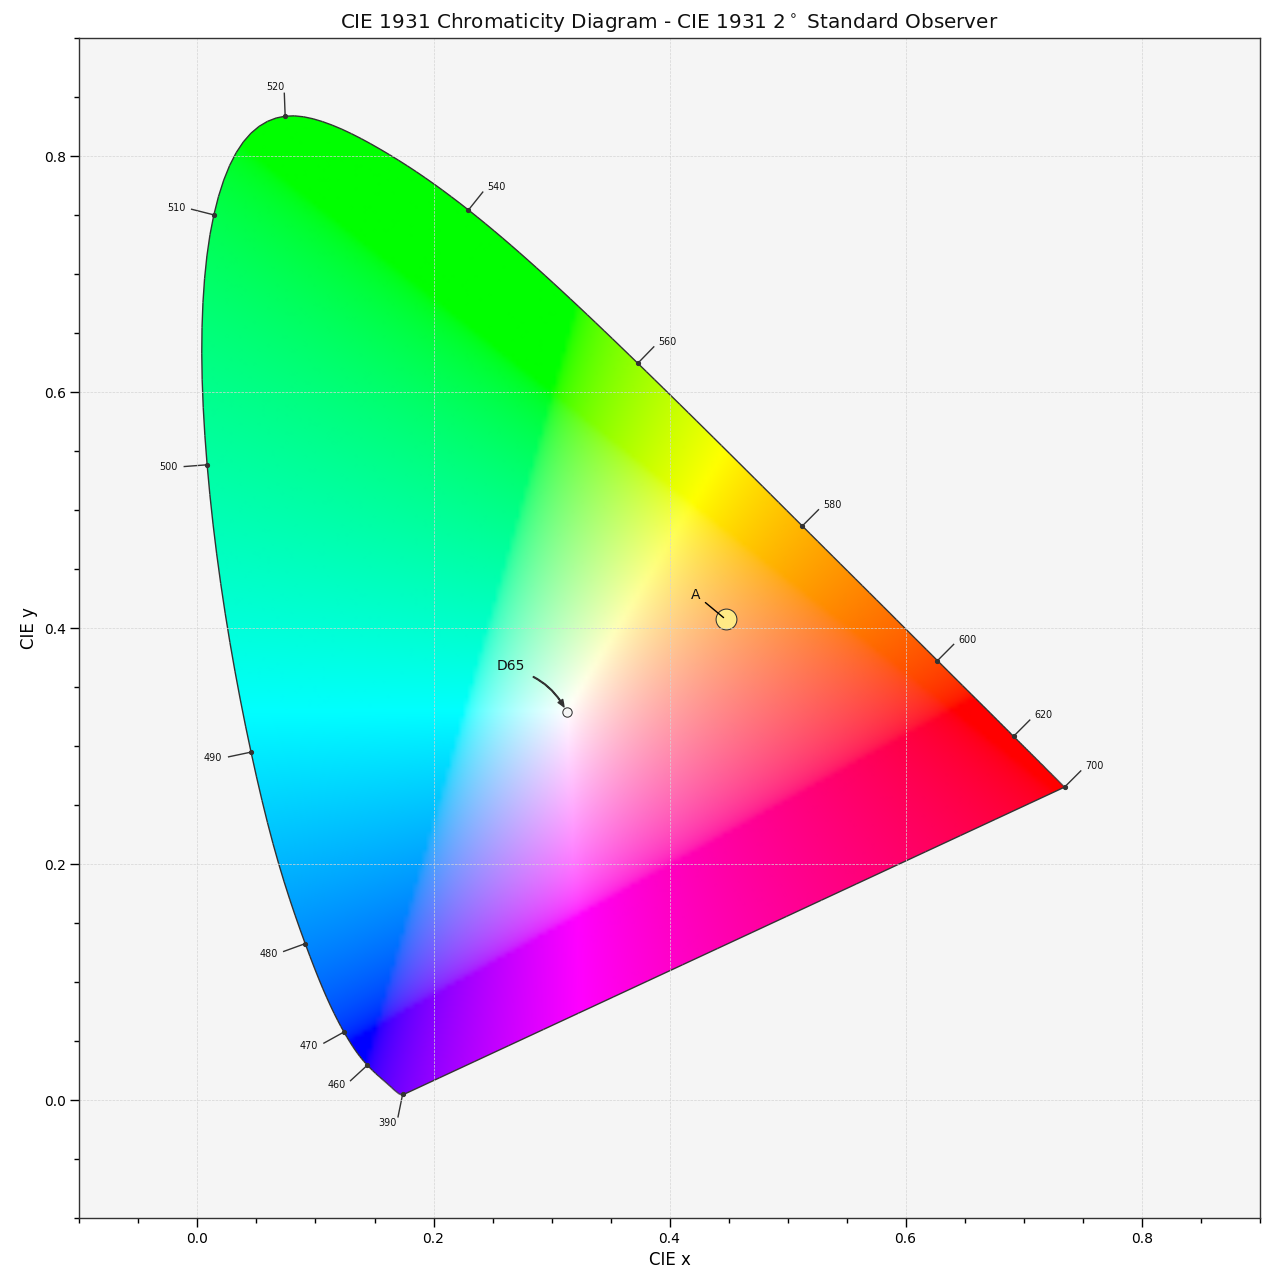
Plot specified spectral distribution chromaticity coordinates into the Chromaticity Diagram using the specified method.
- Parameters:
sds (Sequence[SpectralDistribution | MultiSpectralDistributions] | SpectralDistribution | MultiSpectralDistributions | ValuesView) – Spectral distributions or multi-spectral distributions to plot.
sdscan be a singlecolour.MultiSpectralDistributionsclass instance, a list ofcolour.MultiSpectralDistributionsclass instances or a list ofcolour.SpectralDistributionclass instances.cmfs (MultiSpectralDistributions | str | Sequence[MultiSpectralDistributions | str]) – Standard observer colour matching functions used for computing the spectral locus boundaries.
cmfscan be of any type or form supported by thecolour.plotting.common.filter_cmfs()definition.chromaticity_diagram_callable (Callable) – Callable responsible for drawing the Chromaticity Diagram.
method (Literal['CIE 1931', 'CIE 1960 UCS', 'CIE 1976 UCS'] | str) – Chromaticity Diagram method.
annotate_kwargs (dict | List[dict] | None) –
Keyword arguments for the
matplotlib.pyplot.annotate()definition, used to annotate the resulting chromaticity coordinates with their respective spectral distribution names.annotate_kwargscan be either a single dictionary applied to all the arrows with same settings or a sequence of dictionaries with different settings for each spectral distribution. The following special keyword arguments can also be used:annotate: Whether to annotate the spectral distributions.
plot_kwargs (dict | List[dict] | None) –
Keyword arguments for the
matplotlib.pyplot.plot()definition, used to control the style of the plotted spectral distributions.plot_kwargscan be either a single dictionary applied to all the plotted spectral distributions with the same settings or a sequence of dictionaries with different settings for each plotted spectral distribution. The following special keyword arguments can also be used:illuminant: The illuminant used to compute the spectral distributions colours. The default is the illuminant associated with the whitepoint of the default plotting colourspace.illuminantcan be of any type or form supported by thecolour.plotting.common.filter_cmfs()definition.cmfs: The standard observer colour matching functions used for computing the spectral distributions colours.cmfscan be of any type or form supported by thecolour.plotting.common.filter_cmfs()definition.normalise_sd_colours: Whether to normalise the computed spectral distributions colours. The default is True.use_sd_colours: Whether to use the computed spectral distributions colours under the plotting colourspace illuminant. Alternatively, it is possible to use thematplotlib.pyplot.plot()definitioncolorargument with pre-computed values. The default is True.
kwargs (Any) – {
colour.plotting.artist(),colour.plotting.diagrams.plot_chromaticity_diagram(),colour.plotting.render()}, See the documentation of the previously listed definitions.
- Returns:
Current figure and axes.
- Return type:
Examples
>>> A = SDS_ILLUMINANTS["A"]
>>> D65 = SDS_ILLUMINANTS["D65"]
>>> annotate_kwargs = [
...     {"xytext": (-25, 15), "arrowprops": {"arrowstyle": "-"}},
...     {},
... ]
>>> plot_kwargs = [
...     {
...         "illuminant": SDS_ILLUMINANTS["E"],
...         "markersize": 15,
...         "normalise_sd_colours": True,
...         "use_sd_colours": True,
...     },
...     {"illuminant": SDS_ILLUMINANTS["E"]},
... ]
>>> plot_sds_in_chromaticity_diagram(
...     [A, D65], annotate_kwargs=annotate_kwargs, plot_kwargs=plot_kwargs
... )
...
(<Figure size ... with 1 Axes>, <...Axes...>)